These are the real estate statistics for East Cobb, GA, FMLS area 83. Data is from Smart Numbers reports from the Atlanta FMLS.

These stats are only for single family detached homes.
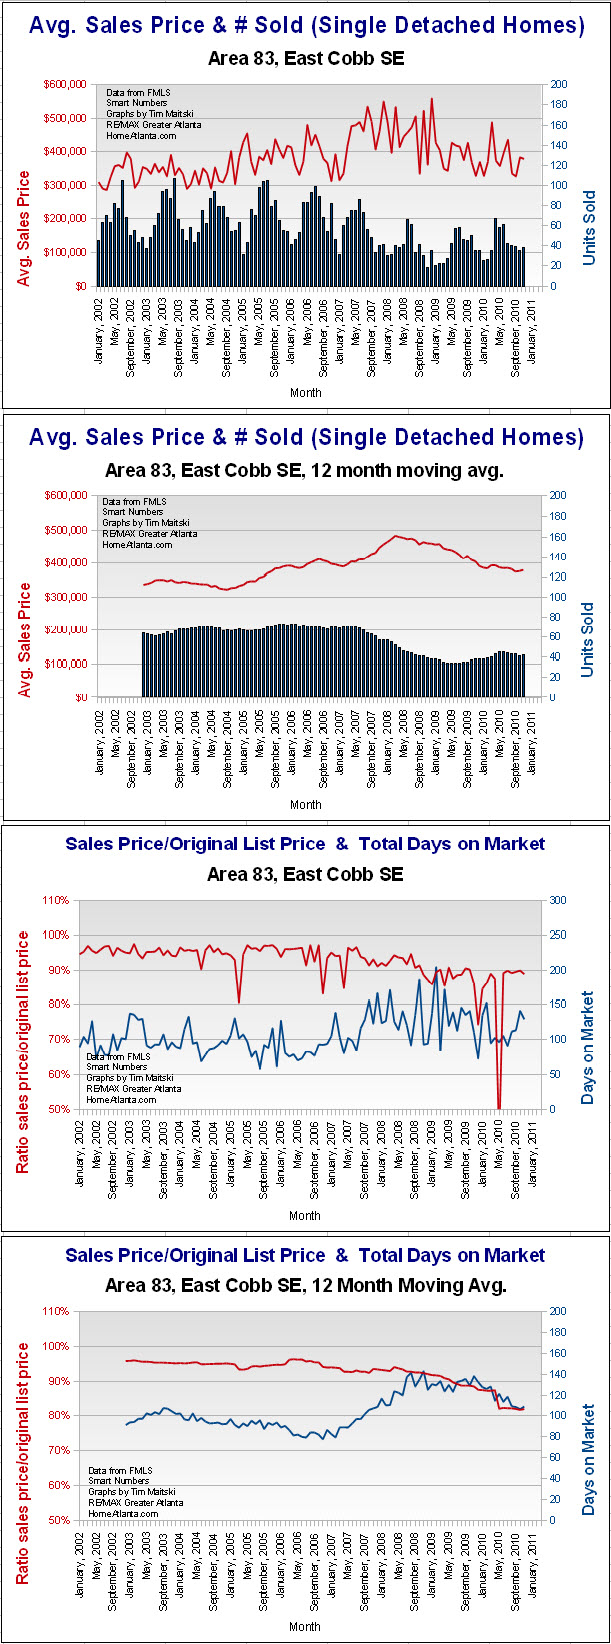
Chart one shows average sales price going back to January 2002. The bars at the bottom show the volume of unit sales.
Chart two just takes the first chart and smooths it out using a volume weighted twelve month moving average. See this post for details on how and why I like this moving average chart.
Chart three is the sale price to original list price ratio along with the total days on market(DOM).
Chart four is the third chart smoothed out with a volume weighted twelve month moving average.
When you are ready to look at homes in person and want the help of an experienced real estate agent, watch the video and then give me a call. My name is Tim Maitski. My cell phone is 404-216-0472. Tell me what you want, send me a list of homes you think are interesting and I'll set up a tour of 10-15 homes. No messing around. Don't over think it. We'll just go out and see a lot of homes. If nothing else, you'll get a quick education on the real estate market around Atlanta. We'll probably find two or three homes that will work for you. We'll compile all of the data, figure out a negotiating strategy, and make some offers. It's not rocket science but it does take organization, perseverance and experience in how the process works. |
Need Help Buying Atlanta Real Estate?
Search the entire Atlanta MLS.
|

Comments (0)Subscribe to CommentsComment