Closed Sales Slow While Pending Sales Soar in Vancouver WA and Clark County WA for January 2012
The Year 2012 didn't exactly start with a bang with respect to Closed Sales in January but, Pending Sales took off like a rocket! Closed Home Sales in Vancouver WA and Clark County performed modestly as in any typical January, as the purchasing activity in December usually slows and results in a lower volume month for January. Coming in at 288 units closed, this is 4 more than the same month in 2010, and 10 less than in 2011. The big news however, is that Pending Sales for January came in at 464 units -- this is 127 units higher than the 337 Pending sales in January the year before! The expected results from the high Pending sales should be a higher number of Closed sales for February and March.
One trend we seem to be stuck in is the falling average sales price, with the 3-month rolling average sales price fell to another low as the overall market exceeds 50% of Foreclosures and Short Sales. While the damaged and distressed properties do seem to be a drag on local housing prices, we are experiencing multiple offer situations for the homes in very good condition as the available inventory of resale homes has shrunken considerably. With resale inventory at "Seller's Market" levels, there is good reason to believe home sales prices should firm up very soon.
The Chart Below (prepared by John Slocum, our resident statistician) is based on home sales entered into the Vancouver MLS system (RMLS), and exclude sales of mobile home; and shows the purchase activity since 2009; charting the 3 month rolling average number of sales, and the 12 month rolling average. This simple "smoothing" of the data better helps illustrate the short-term and longer term trends in Clark County's real estate market.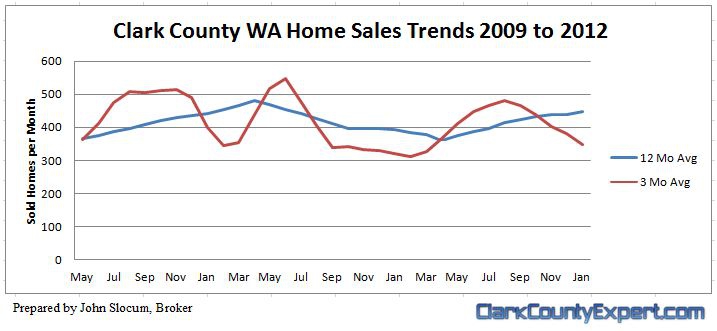
This next chart below shows the Average home sales price trends (3 month and 12 month) for the same time period. As the chart shows, average sales prices have slid again with such a high mix of distressed properties in the total number of sales.
Comparing the 3-month moving average for sales price; we have $205,259 for January 2012 vs. $227,772 for January 2011; a net decrease of $22,514 or -9.9%.
Finally, the Level of Available Resale Inventory is an important indicator of market health; and we show 5.3 months Clark County-wide; and 4.8 months for the sum of Vancouver zip codes -- a number that is substantially lower than last year. We also start to see a seasonal increase of listings in February and March thus, it remains to be seen if the low inventory levels will remain much longer.
Charts: For the enthusiasts that like to examine charts, we have the sales results for the Resold Inventory (excludes new homes) by Community that you may find helpful:
Clark County WA Home Sales Results and Charts
Battle Ground WA Home Sales Results and Charts
Brush Prairie & Hockinson Home Sales Results and Charts
Camas WA Home Sales Results and Charts
La Center WA Home Sales Results and Charts
Ridgefield WA Home Sales Results and Charts
Vancouver WA Home Sales Results and Charts
Washougal WA Home Sales Results and Charts
Please let us know if you have any specific questions or comments!
Note: the above statistics include Vancouver Washington Condominiums for Sale; and Luxury Market Homes for sale in Vancouver Washington.
Recent Related Posts you may find of interest:
Clark County WA Housing Affordability Q3-2011 | Moving to another High!
Clark County WA Real Estate Market Snapshot for January 2012
Real Estate Wrap Up for Vancouver WA 2011
Disclaimer: as with any real estate statistics, we do our best to provide the best representation at the time the data was acquired. We deem the data and reports reliable but not guaranteed.

Comments(0)