
Everyone wants to know the best time to buy, sell or hold real estate. Three factors, explained in the charts below, help you anticipate the best action for 2014 and beyond. These factors strongly suggest home price gains have topped out.
Today’s yield spread is near the highest it’s been since 2011. However, a high yield spread on its own is not enough to signal future prosperity for the housing market.
Home sales volume experienced no long-term change from 2009 to 2013, but has since decreased in 2014. Home prices are still riding high on a wave of speculator activity as of Q3 2014, but the rise has decelerated quickly. Home prices began to fall at the end of Q3 2014, and they are expected to continue falling in the coming months, bottoming in 2015. Home pricing won’t likely return to today’s speculator-driven levels until the next peak in pricing, expected in 2019-2020.
Today’s mixed signals of a high yield spread, low sales volume and inflated prices indicate today is a hold phase for real estate investors.
Chart 1
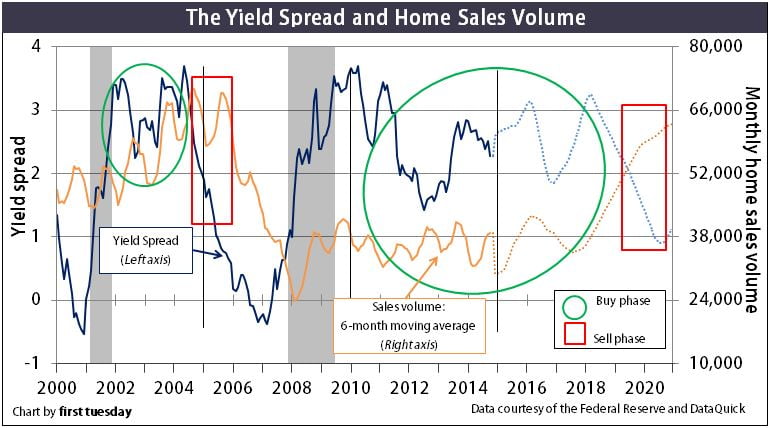
Chart update 11/13/14
| Oct 2014 | Sep 2014 | Oct 2013 | |
| Yield spread | 2.28 |
2.51
|
2.54 |
| Home sales volume | 36,830 | 36,316 | 36,468 |
There is a 1-month reporting delay for home sales volume data.
Chart 2
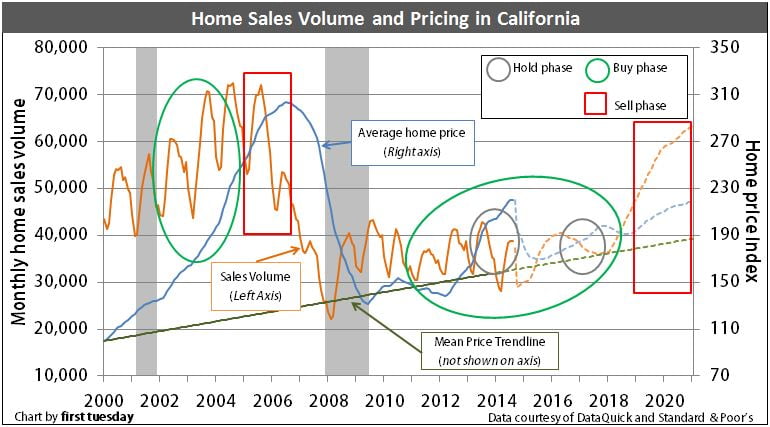
Chart update 11/13/14
| Aug 2014 | July 2014 | Aug 2013 | |
| Home sales volume | 37,228 | 39,608 | 42,546 |
| Average home price movement | 220 |
220
|
197
|
There is a 1-2 month reporting delay for pricing and home sales data.
These market charts are your investment planner. They tell you when a business cycle will enter a buy phase, sell phase or hold phase.
To buy or sell in 2014?
The best action for today’s housing market can be found by examining three factors:
- the yield spread (which forecasts future economic performance one year hence and is the difference between the 10-year Treasury Note and the 3-Month Treasury Bill rates);
- home sales volume (which forecasts home price movement nine months hence); and
- home pricing (the crucial factor of whether rent, (as a base for applying a capitalization rate a prudent investor will use to discount future Net Operating Income (NOI)), supports current pricing).
The investor’s goal
The key to successful real estate investing is to look beyond the property’s annual operating income to the end goal: a sale. Whether on a quick flip or after a long-term buy-to-let period, the endgame is to profit on a resale. That is, to sell at a price appreciated beyond the price paid and consumer inflation.
For investors to sell for a profit, they first need to buy at the bottom of a market cycle — the buy phase. This is when property prices are closest to their historic mean price. [See Chart 2]
It is rarely, if ever, possible to identify the top or bottom of a market cycle until after it has already passed. However, studied effort makes it more likely.
The actual decision of whether to buy or not depends not only on the economy — which is highly localized — but also on the specific homebuyer, and the seller’s willingness to carry paper.
2014 and the following few years will not be times of untrammeled get-rich-quick investment opportunities. Nonetheless, if you have an eye for long-term market stability in real estate prices, you will be rewarded.


About The Author
ft Editorial Staff
is the writing staff comprised of legal editor Fred Crane, In-House Broker Consultant Fernando Nunez and writer-editors Connor P. Wallmark, Giang Hoang-Burdette, Carrie B. Reyes, Matthew Taylor and Sarah Kolvas, and graphic designer Mary LaRochelle.

Comments(0)