Market Report For Arizona, September 2015 (Part 1)
Click here to open Part 2 in a new window
Market Summary
Residential, September 2015
| Summary Statistics | ||||||
| Sep-15 | Sep-14 | % Chg | 2015 YTD | 2014 YTD | % Chg | |
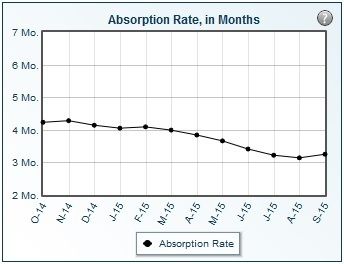
| Absorption Rate | 3.25 | 4.11 | -20.92 | 3.63 | 4.16 | -12.74 |
| Average List Price | $453,735 | $390,184 | 16.29 | $341,370 | $315,265 | 8.28 |
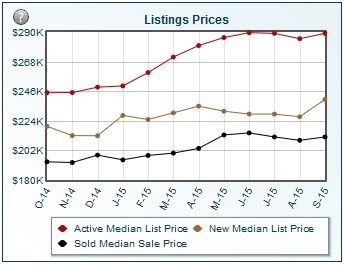
| Median List Price | $289,000 | $241,493 | 19.67 | $234,900 | $215,000 | 9.26 |
| Average Sale Price | $259,362 | $246,114 | 5.38 | $262,734 | $249,324 | 5.38 |
| Median Sale Price | $212,000 | $194,500 | 9.00 | $207,500 | $192,000 | 8.07 |
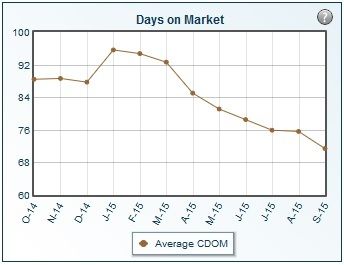
| Average CDOM | 71 | 84 | -15.48 | N/A | N/A | N/A |
| Median CDOM | 42 | 55 | -23.64 | 47 | 53 | -11.32 |
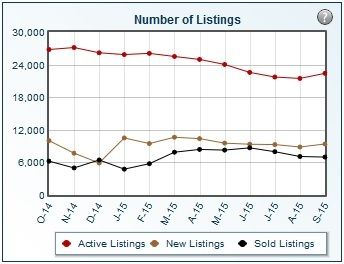
| Sold Listings | ||||||
| This Month | Year to Date | |||||
| 2015 | 2014 | % Chg | 2015 | 2014 | % Chg | |
| 0-29,999 | 13 | 28 | -53.6 | 185 | 275 | -32.7 |
| 30,000-39,999 | 26 | 39 | -33.3 | 315 | 437 | -27.9 |
| 40,000-49,999 | 54 | 42 | 28.6 | 461 | 510 | -9.6 |
| 50,000-59,999 | 48 | 59 | -18.6 | 522 | 707 | -26.2 |
| 60,000-69,999 | 69 | 98 | -29.6 | 708 | 889 | -20.4 |
| 70,000-79,999 | 79 | 130 | -39.2 | 838 | 1126 | -25.6 |
| 80,000-89,999 | 97 | 115 | -15.7 | 1036 | 1199 | -13.6 |
| 90,000-99,999 | 123 | 119 | 3.4 | 1123 | 1251 | -10.2 |
| 100,000-119,999 | 267 | 338 | -21.0 | 2944 | 3486 | -15.5 |
| 120,000-139,999 | 469 | 567 | -17.3 | 5166 | 5472 | -5.6 |
| 140,000-159,999 | 634 | 612 | 3.6 | 6119 | 5824 | 5.1 |
| 160,000-179,999 | 704 | 598 | 17.7 | 6257 | 5400 | 15.9 |
| 180,000-199,999 | 592 | 519 | 14.1 | 5434 | 4459 | 21.9 |
| 200,000-249,999 | 1185 | 986 | 20.2 | 10758 | 8720 | 23.4 |
| 250,000-299,999 | 864 | 654 | 32.1 | 7596 | 6011 | 26.4 |
| 300,000-399,999 | 884 | 706 | 25.2 | 8083 | 6324 | 27.8 |
| 400,000-499,999 | 380 | 304 | 25.0 | 3511 | 2785 | 26.1 |
| 500,000-549,999 | 110 | 60 | 83.3 | 932 | 768 | 21.4 |
| 550,000-749,999 | 203 | 140 | 45.0 | 1868 | 1625 | 15.0 |
| 750,000-999,999 | 112 | 73 | 53.4 | 960 | 755 | 27.2 |
| 1,000,000-1,249,999 | 26 | 19 | 36.8 | 323 | 299 | 8.0 |
| 1,250,000-1,499,999 | 16 | 12 | 33.3 | 207 | 182 | 13.7 |
| 1,500,000-1,999,999 | 17 | 23 | -26.1 | 213 | 194 | 9.8 |
| 2,000,000-2,999,999 | 9 | 7 | 28.6 | 134 | 122 | 9.8 |
| 3,000,000+ | 1 | 9 | -88.9 | 74 | 62 | 19.4 |
| Totals | 6982 | 6257 | 11.6 | 65767 | 58882 | 11.7 |
| Pending Listings | ||||||
| This Month | Year to Date | |||||
| 2015 | 2014 | % Chg | 2015 | 2014 | % Chg | |
| 0-29,999 | 10 | 18 | -44.4 | 145 | 215 | -32.6 |
| 30,000-39,999 | 21 | 30 | -30.0 | 297 | 412 | -27.9 |
| 40,000-49,999 | 44 | 63 | -30.2 | 430 | 528 | -18.6 |
| 50,000-59,999 | 54 | 61 | -11.5 | 519 | 680 | -23.7 |
| 60,000-69,999 | 63 | 77 | -18.2 | 701 | 846 | -17.1 |
| 70,000-79,999 | 60 | 95 | -36.8 | 820 | 1078 | -23.9 |
| 80,000-89,999 | 67 | 121 | -44.6 | 978 | 1270 | -23.0 |
| 90,000-99,999 | 90 | 136 | -33.8 | 1154 | 1298 | -11.1 |
| 100,000-119,999 | 196 | 297 | -34.0 | 2741 | 3365 | -18.5 |
| 120,000-139,999 | 370 | 527 | -29.8 | 5157 | 5659 | -8.9 |
| 140,000-159,999 | 448 | 543 | -17.5 | 6050 | 5935 | 1.9 |
| 160,000-179,999 | 505 | 535 | -5.6 | 6452 | 5495 | 17.4 |
| 180,000-199,999 | 424 | 469 | -9.6 | 5570 | 4752 | 17.2 |
| 200,000-249,999 | 811 | 865 | -6.2 | 10956 | 9078 | 20.7 |
| 250,000-299,999 | 564 | 660 | -14.5 | 7707 | 6433 | 19.8 |
| 300,000-399,999 | 614 | 665 | -7.7 | 8440 | 6734 | 25.3 |
| 400,000-499,999 | 248 | 284 | -12.7 | 3643 | 3026 | 20.4 |
| 500,000-549,999 | 62 | 64 | -3.1 | 929 | 712 | 30.5 |
| 550,000-749,999 | 139 | 169 | -17.8 | 1960 | 1846 | 6.2 |
| 750,000-999,999 | 57 | 88 | -35.2 | 1035 | 819 | 26.4 |
| 1,000,000-1,249,999 | 20 | 19 | 5.3 | 297 | 261 | 13.8 |
| 1,250,000-1,499,999 | 14 | 26 | -46.2 | 263 | 250 | 5.2 |
| 1,500,000-1,999,999 | 14 | 19 | -26.3 | 220 | 204 | 7.8 |
| 2,000,000-2,999,999 | 7 | 17 | -58.8 | 153 | 150 | 2.0 |
| 3,000,000+ | 4 | 9 | -55.6 | 81 | 68 | 19.1 |
| Totals | 4906 | 5857 | -16.2 | 66698 | 61114 | 9.1 |

Click here to view all of the Shanna Day Team Featured Listings
FUTURE QUESTIONS
If you have any topics or questions you would like answered, contact The Shanna Day Dream Home Team - we’ll find the answers for you!
Shanna Day Dream Home Team
Keller Williams Realty East Valley
480-415-7616
View ShannaDay Dream Team Profile

Comments(0)