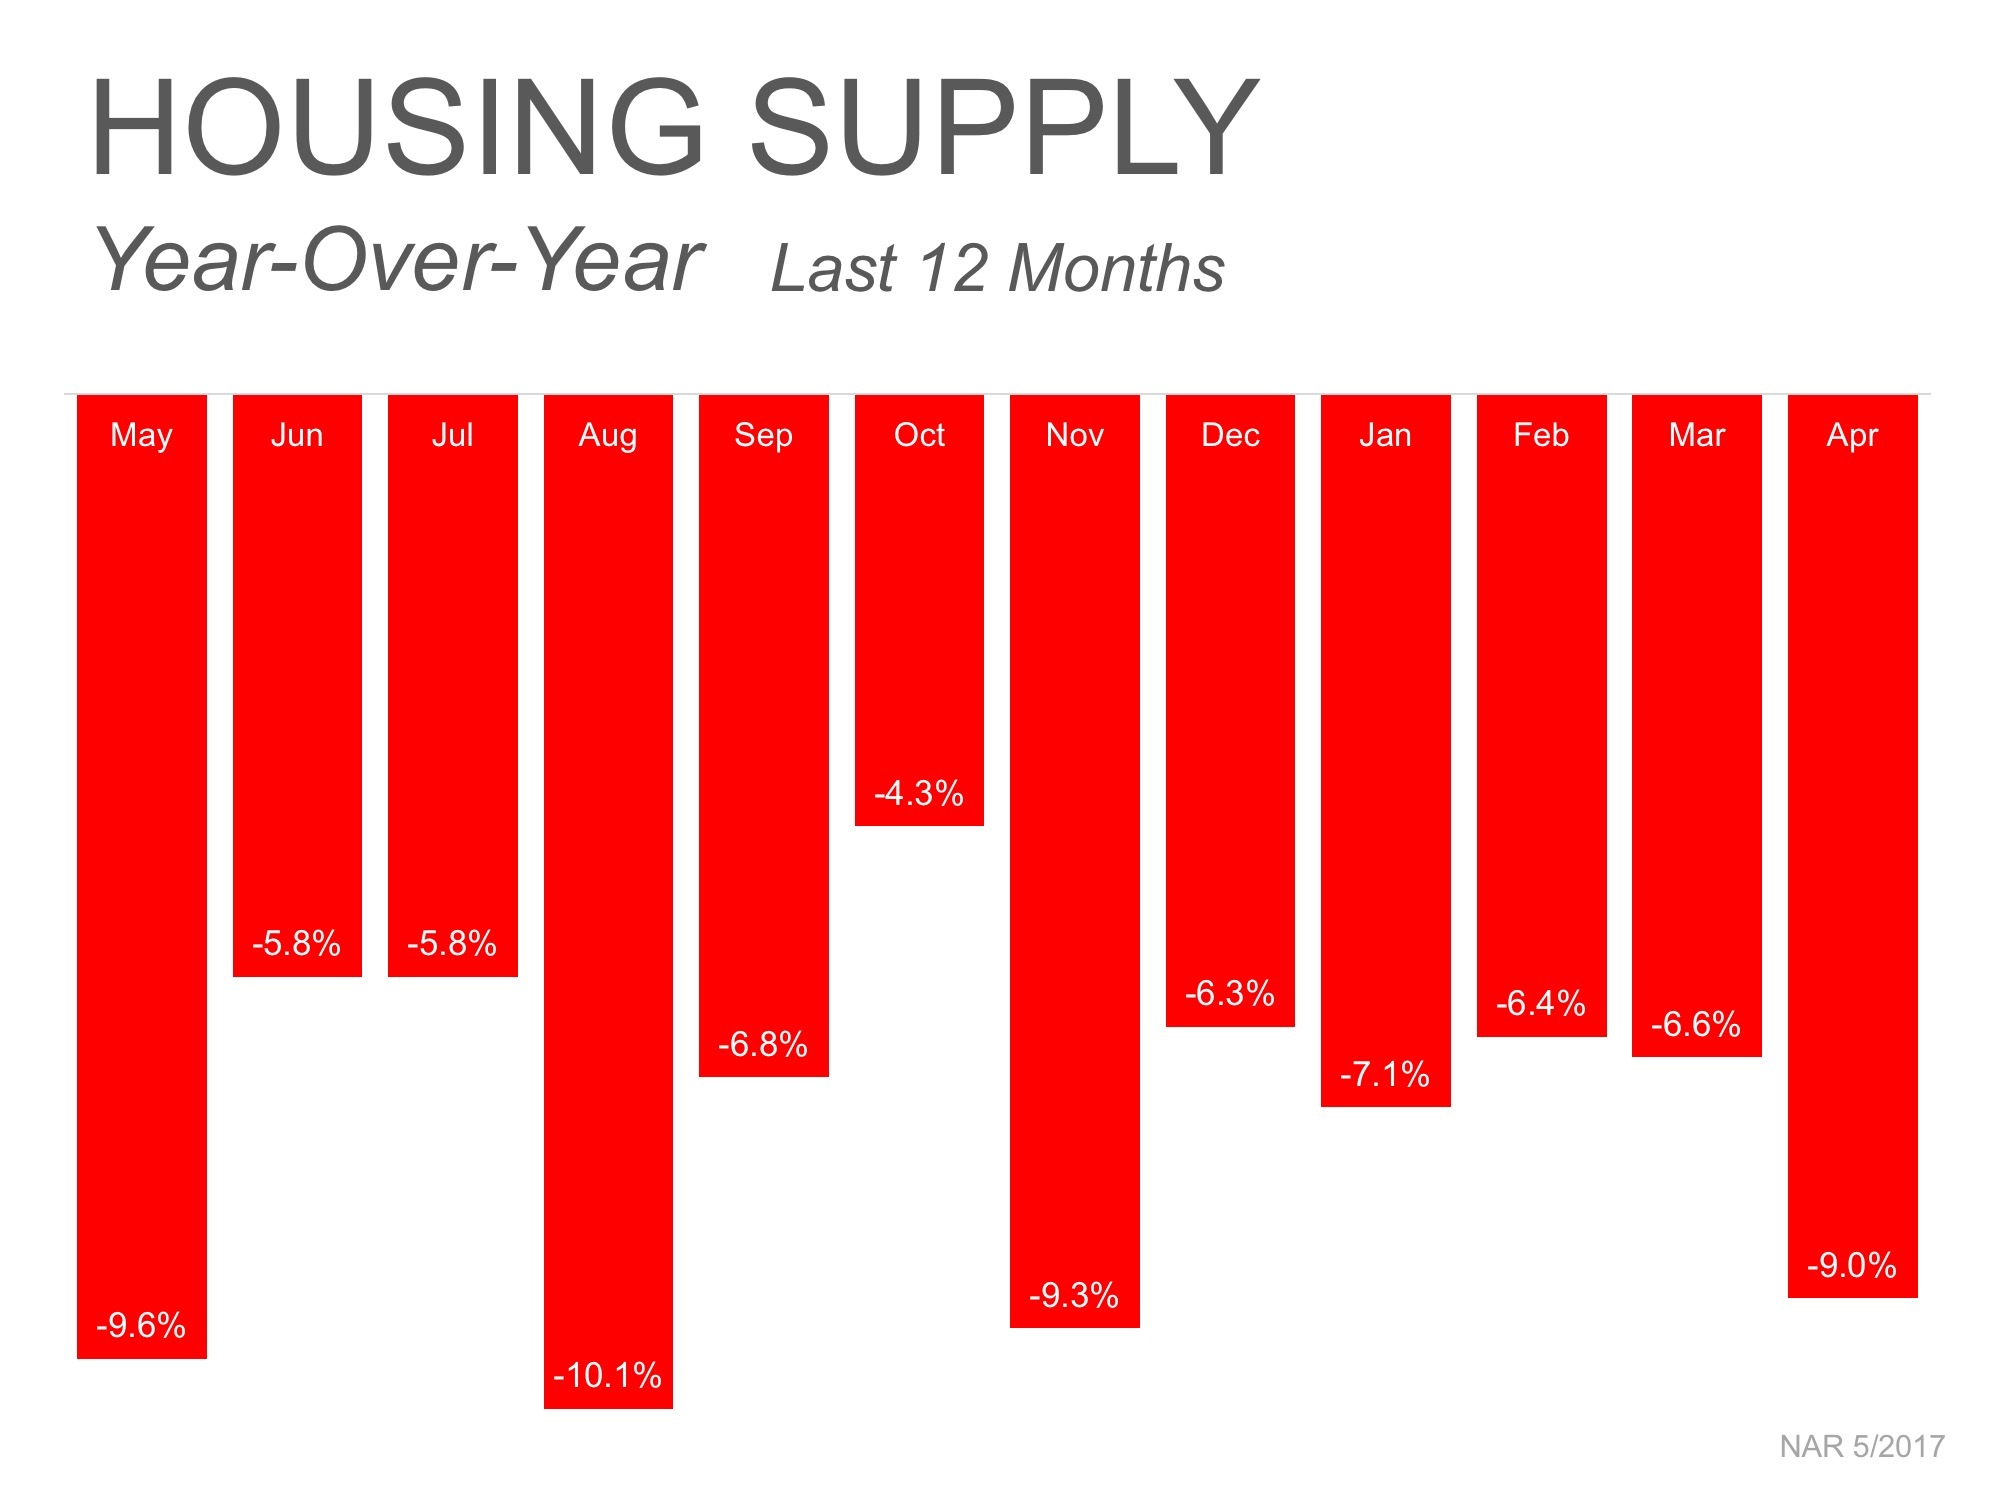
When I first spotted this graphic on Nina Hollander's post, I knew I needed to snatch it. (Thank you, Nina.) In part because this chart tells the story so clearly and illustrates what is wrong with real estate inventory, not only in Sacramento right now, but across the country (courtesy of NAR). We are not alone in Sacramento with this huge problem.
Even more interesting is comparing 12 months of inventory in 2005 to our last 12 months of inventory in Sacramento real estate. Sometimes, although I don't go there very often, it's good to look in the rear view mirror to recall where we once were.
What does this mean to consumers? It means if you could pluck a time over the past 25 years to sell a home, this is the VERY BEST TIME you could ever in a million years hope for to sell your home. If you're trying to buy a home, this might be the last chance you will ever get at these low prices and interest rates. Speaking to buyers, you can only buy if you're lucky enough and hire the right agent to help you. Don't let dismal inventory dissuade.
You can read more in my personal blog today at this link: Compare 2005 and 2017 Sacramento Real Estate Inventory.


Comments(14)