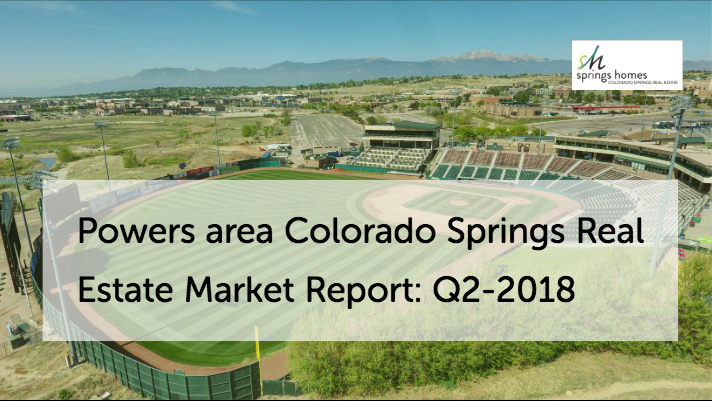
The Powers Corridor is located on the eastern boundary of Colorado Springs, Colorado. This is a large area and consists of smaller subdivisions like Stetson Hills, Springs Ranch, Indigo Ranch and Cimarron Hills.
The area first became popular in the mid-90s when Home Builders started producing affordable new construction on what was at the time considered the eastern edge of the city. As commercial development started around the area, the residential portion gained in popularity.
Today the powers Corridor is home to some of the most dense commercial amenities in El Paso County. This area is very convenient and almost centrally located as the area grew to the east. As you’ll in many of the charts below the area really started to gain and popularity around 2011 through today.
The Powers Corridor has become an interesting study in the growth and development of Colorado Springs. Here are the real estate statistic for the second quarter of 2018.
| Number of Sales | 530 |
| Average Days on Market | 12 |
| Median Sales Price | $300,000 |
| List Price Per Square Foot | $134 |
| List to Sales Price Ratio | 100.5% |
Number of Sales
The chart below clearly shows the powers area growing sales consistently from 2011 through what seems to be 2018. The drop off in the second quarter of 2018 is most likely attributable to the lack of inventory. The chart below the number of sales chart shows Supply vs demand. you can clearly see that around 2017 demand began to outpace supply. This is very obvious buy 2018 the red sold listing line is above the blue available listing line. This is the sign of a very strong seller's market.


Average Days on Market
In residential real estate a balanced market is generally thought of as one with 6 months of inventory available. More inventory is considered a buyer's market less inventory a seller's market. In Q2 of 2018 the average days on Market in the powers Corridor is 12 days and as we saw in the previous chart there is much more demand than Supply, so this area is in an extremely strong seller's market.

Median Sales Price
As with any commodity, supply and demand Drive price. This is certainly the case in the powers corridor. the second quarter of 2018 saw the median sales price in the powers area Skyrocket to $300,000. is a really surprising number for people who have been in the Colorado Springs area for a while, the powers area has traditionally been thought of as more affordable housing then the core of the city.
Much of this demand has been fueled bye growth and development of retail amenities in that area along with new construction east of powers in the Banning Lewis Ranch subdivision as well as Meridian Ranch and Woodmen Hills to the east of that.

We just completed a new video about the Stetson Hills neighborhood which is right at the heart of the powers corridor. If you take a look and you'll see the commercial density and traffic in the area. This wasn't the case a few short years ago but Stetson Hills and The overall Powers area extremely popular.
Stetson Hills Neighborhood
Price Per Square Foot
This statistic is generally a measure of the type of homes in a particular area. As the powers Corridor grows the size and type of the homes is certainly improving and quality from the early years. $134 a square foot is the new asking price in this area, $150 a square foot is a watermark for luxury Construction in El Paso County. So, although we aren't seeing much luxury development in the powers Corridor the price per square foot is slowly creeping up into that range. We have to assume this is based on demand.

List Price to Sales Price Ratio
Finally, we get to the list price to sales price ratio, as the chart shows this ratio was fairly balanced from 2009 through about 2014. Since 2015 it's steadily stayed at 100% And finally in the second quarter of 2018 gone up above 100%. This means buyers are offering more than list price and creating bidding situations which drive this ratio up.

In Conclusion
The powers Corridor has finally arrived. The years of commercial development in conjunction with its location who finally made it a truly hot area. The concern, of course, becomes affordability but as Colorado Springs continues to grow attracting newer and better jobs one can only assume the Powers area will continue to grow.
If you would like to stay informed on the Colorado Springs Real Estate market as well, you can sign up to receive our Quarterly Market Reports.
We have been compiling statistics both locally and nationally for many years. These reports are a collection of the last few years' worth of our Quarterly Market Reports so you can follow the Colorado Springs Real Estate Market.


Comments(1)