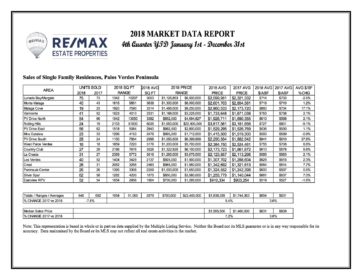
In my January 17, 2019, article, I discussed the overall sales numbers for single family Palos Verdes homes sold in 2018 with an increase in the median sales price (7.2%), average price per square foot (3.6%), average sales price (5.4%), and a decrease in the number of homes sold (7.5%). Inventory of Palos Verdes homes for sale was low again last year and multiple offers were common as buyers sought to purchase Palos Verdes homes. Below is information on specific Palos Verdes neighborhoods. The chart above can be enlarged by clicking on it or go to the “Statistics” tab above.
Malaga Cove posted the largest gain in average sales price – $2,960,533 for 2018 compared to $2,173,720 in 2017; Rolling Hills was second with an average sales price of $3,817,561 in 2018 compared to $3,181,658 in 2017. The Palos Verdes Drive South, County Club, Palos Verdes Drive North, Silver Spur and Peninsula Center neighborhoods also showed significant gains in average sales price for 2018. The Valmonte, Crest, Los Verdes, La Cresta, Palos Verdes Drive East, and Eastview neighborhoods also showed gains in average sales price. Monte Malaga posted the largest decrease in average sales price – $2,601,703 for 2018 compared to $2,854,581 in 2017.
All but 4 neighborhoods posted gains in average square foot price in 2018. Palos Verdes Drive South and Malaga Cove posted the largest gains in average square foot price for Palos Verdes homes sold – a 37.8% increase 17.1% respectively. Palos Verdes Drive South increased to $841 in 2018 from $610 in 2017 and Malaga Cove increased to $860 in 2018 compared to $734 in 2017. The City of Rolling Hills had the largest decrease in square foot price (9.1%) from $801 in 2017 to $727 in 2018. Homes in Malaga Cove sold for the highest price per square foot – $860.
Lunada Bay posted the largest number of Palos Verdes homes sold in 2018 – 75 Palos Verdes houses (73 homes in 2017). The City of Rolling Hills posted the biggest gain in home sales – 24 in 2018 compared to 19 in 2017. Palos Verdes Drive South (28 homes sold in 2018 from 24 homes sold in 2017), La Cresta (31 homes sold in 2018 from 27 homes in 2017), and Silver Spur (62 homes sold in 2018 from 58 in 2017) also had gains in Palos Verdes homes sales. All other Palos Verdes neighborhoods had a decrease in number of homes sold in 2017 except for Peninsula Center which was the same.
The total valuation of single family Palos Verdes homes sold in 2018 was $1,190,181,112. The highest priced single family Palos Verdes home sold for $22,400,000 in the City of Rolling Hills and the lowest priced Palos Verdes home sold for $700,000 (Rancho Palos Verdes) and was located in Eastview RPV. 2018 information on the sales price mix for Palos Verdes homes sold can be obtained by clicking here or going to my prior post, “Palos Verdes Home Values Strong In 2018!”
Originally posted to Elaine Carlson's real estate blog PalosVerdesSource.com.
Above chart courtesy of RE/MAX Estate Properties

Comments(1)