Here is a look at the midtown Tulsa, OK housing market as of March 25, 2021.

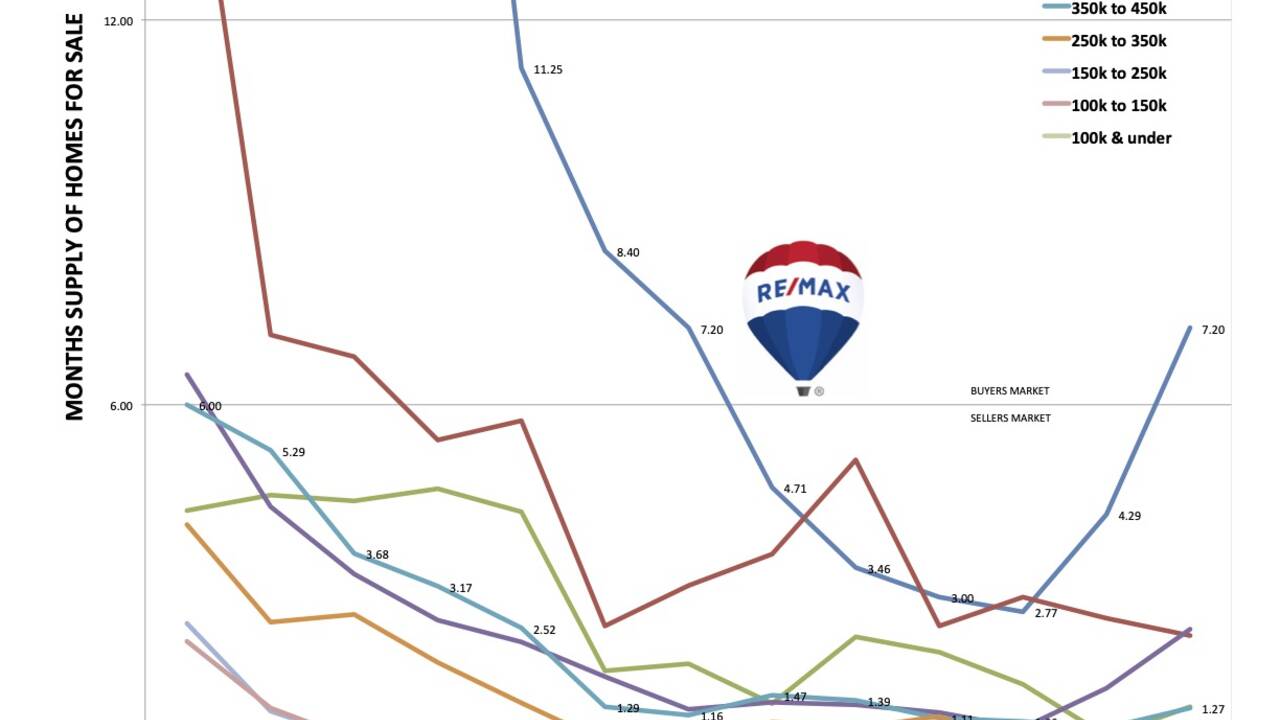
The following graph shows the change in the 3-month absorption rate over the past twelve months for single-family homes (i.e., houses) in midtown Tulsa, OK.

This article is an analysis of the market for single-family homes in midtown Tulsa, Oklahoma for the period from December 2020 through March 25, 2021. It analyzes the trends and shifts in the real estate market for houses in midtown Tulsa since the previous month (February 2021).
This post is a study of the supply and demand for single-family homes, an analysis of the housing market for houses, using MLS statistics for houses (single-family homes) to show:
- the hotness index for houses, calculating the ratio between pending and active MLS listings;
- the velocity of the real estate market, showing how many houses are selling each month;
- the 3-month absorption rate, showing the current supply of houses on the market or how long it will take to sell all the houses currently on the market (assuming no other single-family homes come on the market);
- the odds of selling over the next 90 days, using the absorption rate and comparing it to all the rooftops in the market (the active, pending, closed, expired, released and withdrawn listings in the MLS).
This analysis will show the market trends in order to spot shifts in the market. Graphs show the change in the 3-month absorption rate and show whether a particular price point is in a buyer’s market or a seller’s market.
Methodology
Each month on the 25th I pull CMAs and then plug the data into a spreadsheet so that I can look at the real estate market at various price points and see how it is doing by comparison to the previous month. I then have my husband graph the change in the 3-month absorption rate.
How does one define “midtown Tulsa?” Many people will tell you that midtown Tulsa is an area of luxury homes around Utica Square and Woodward Park, or even from the river to Harvard between 15th Street and 41st Street southeast of downtown Tulsa.
However, in order to get statistics in every price point to cover Brookside, Florence Park, White City, the Pearl District, Riverwood, Maple Ridge, Patrick Henry and Bolewood, I extended the boundaries to be very broad. There is a home for each of us in midtown Tulsa!
The “midtown Tulsa” area covered therefore includes single-family houses located between I-244 and Skelly Drive at I-44 between Riverside Drive at the Arkansas River and Sheridan Road . All houses are in the Tulsa Public School District.
When it comes to houses in midtown Tulsa here is what I discovered:
Midtown Tulsa Houses at All Price Points
In midtown Tulsa there are 86 active listings and 200 pending listings, giving us a “hotness index” of 232.56%.
With 313 listings sold in the last three months, there is a sales velocity of 104.3 homes sold per month. The resulting 3-month absorption rate for all price points is 0.82 months. That is a three week supply of houses for sale in midtown Tulsa.
With 677 total houses in the market (active, pending, closed, expired, released and withdrawn listings), the odds of selling a house in midtown Tulsa within the next 90 days are 46.23%. Those odds are a bit better than last month (45.95%).
Midtown Tulsa Houses Priced Up to $100,000
In the price point under $100,000 there is 1 active listing and 8 pending listings, giving us a “hotness index” of 800.00%.
With 18 listings sold in the last three months, there is a sales velocity of 6.0 homes sold per month. The resulting 3-month absorption rate for the price point under $100,000 is 0.17 months. That is a one-week supply of houses in midtown Tulsa that are priced under $100,000.
With 28 total houses in the market (active, pending, closed, expired, released and withdrawn listings) in the price point below $100,000, the odds of selling a house in midtown Tulsa within the next 90 days are 64.29%. These odds are not quite as good as last month (65.52%).
Midtown Tulsa Houses Priced from $100,000 to $150,000
In the price point ranging between $100,000 and $150,000 there are 7 active listings and 39 pending listings, giving us a “hotness index” of 557.14%.
With 49 listings sold in the last three months, there is a sales velocity of 16.3 homes sold per month. The resulting 3-month absorption rate for houses in the price point ranging between $100,000 and $150,000 is 0.43 months. That is a 2-week supply of houses selling between $100,000 and $150,000.
With 105 total houses in the market (active, pending, closed, expired, released and withdrawn listings) in the price point between $100,000 and $150,000 the odds of selling a house in midtown Tulsa within the next 90 days is 46.67%. These odds are not quite as good as last month (48.51%).
Midtown Tulsa Houses Priced from $150,000 to $250,000
In the price point ranging between $150,000 and $250,000 there are 13 active listings and 61 pending listings, giving us a “hotness index” of 469.23%.
With 119 listings sold in the last three months, there is a sales velocity of 39.7 homes sold per month. The resulting 3-month absorption rate for houses in the price point ranging between $150,000 and $250,000 is 0.33 months. That is a 2-week supply of houses selling between $100,000 and $150,000.
With 209 total houses in the market (active, pending, closed, expired, released and withdrawn listings) in the price point between $150,000 and $250,000 the odds of selling a house in midtown Tulsa within the next 90 days is 56.94%. These odds are slightly better than last month (52.07%).
Midtown Tulsa Houses Priced from $250,000 to $350,000
In the price point ranging between $250,000 and $350,000 there are 9 active listings and 31 pending listings, giving us a “hotness index” of 344.44%.
With 51 listings sold in the last three months, there is a sales velocity of 17.0 homes sold per month. The resulting 3-month absorption rate for houses in the price point ranging between $250,000 and $350,000 is 0.53 months. That is a 2-week supply of houses selling between $250,000 and $350,000.
With 100 total houses in the market (active, pending, closed, expired, released and withdrawn listings) in the price point between $250,000 and $350,000 the odds of selling a house in midtown Tulsa within the next 90 days is 51.00%. These odds are not quite as good as last month (51.65%).
Midtown Tulsa Houses Priced from $350,000 to $450,000
In the price point ranging between $350,000 and $450,000 there are 11 active listings and 18 pending listings, giving us a “hotness index” of 163.64%.
With 26 listings sold in the last three months, there is a sales velocity of 8.7 homes sold per month. The resulting 3-month absorption rate for houses in the price point ranging between $350,000 and $450,000 is 1.27 months. That is a 5-week supply of houses selling between $350,000 and $450,000.
With 62 total houses in the market (active, pending, closed, expired, released and withdrawn listings) in the price point between $350,000 and $450,000 the odds of selling a house in midtown Tulsa within the next 90 days is 41.94%. These odds are not quite as good as last month (42.37%).
Midtown Tulsa Houses Priced from $450,000 to $600,000
In the price point ranging between $450,000 and $600,000 there are 10 active listings and 15 pending listings, giving us a “hotness index” of 150.00%.
With 12 listings sold in the last three months, there is a sales velocity of 4.0 homes sold per month. The resulting 3-month absorption rate for houses in the price point ranging between $450,000 and $600,000 is 2.5 months. That is a 10-week supply of houses selling between $450,000 and $600,000.
With 43 total houses in the market (active, pending, closed, expired, released and withdrawn listings) in the price point between $450,000 and $600,000 the odds of selling a house in midtown Tulsa within the next 90 days is 27.91%. These odds are not nearly as good as last month (44.19%).
Midtown Tulsa Houses Priced from $600,000 to $800,000
In the price point ranging between $600,000 and $800,000 there are 9 active listings and 9 pending listings, giving us a “hotness index” of 100.00%.
With 21 listings sold in the last three months, there is a sales velocity of 7.0 homes sold per month. The resulting 3-month absorption rate for houses in the price point ranging between $600,000 and $800,000 is 1.29 months. That is a 5-week supply of houses selling between $600,000 and $800,000.
With 54 total houses in the market (active, pending, closed, expired, released and withdrawn listings) in the price point between $600,000 and $800,000 the odds of selling a house in midtown Tulsa within the next 90 days is 38.89%. These odds are better than last month (33.96%).
Midtown Tulsa Houses Priced from $800,000 to $1,200,000
In the price point ranging between $800,000 and $1,200,000 there are 16 active listings and 18 pending listings, giving us a “hotness index” of 112.50%.
With 20 listings sold in the last three months, there is a sales velocity of 6.7 homes sold per month. The resulting 3-month absorption rate for houses in the price point ranging between $800,000 and $1,200,000 is 2.40 months. That is a 10-week supply of houses selling between $800,000 and $1,200,000.
With 68 total houses in the market (active, pending, closed, expired, released and withdrawn listings) in the price point between $800,000 and $1,200,000 the odds of selling a house in midtown Tulsa within the next 90 days is 29.41%. These odds are slightly better than last month (28.57%).
Midtown Tulsa Houses Priced from $1,200,000 and Above
In the price point ranging from $1,200,000 and above there are 12 active listings and 10 pending listings, giving us a “hotness index” of 83.33%.
With 5 listings sold in the last three months, there is a sales velocity of 1.7 homes sold per month. The resulting 3-month absorption rate for houses in the price point ranging from $1,200,000 and above is 7.20 months. That is a 30-week supply of houses selling above $1,200,000.
With 34 total houses in the market (active, pending, closed, expired, released and withdrawn listings) in the price point from $1,200,000 and above the odds of selling a house in midtown Tulsa within the next 90 days is 14.71%. These odds are not as good as last month (21.21%).
Debbie Durkee can send you the raw data that went into the above market analysis. The data comes from what we call a comparative analysis.
Helpful Links
To search for homes for sale (single-family houses for sale) in Midtown Tulsa, go to Midtown Tulsa, OK Homes for Sale
To see an interactive map of midtown Tulsa neighborhoods, more specifically, the INCOG map of the City of Tulsa’s neighborhood associations, go to Tulsa Neighborhood Associations
____________________
Copyright © 2021 Deborah M. Durkee. ALL RIGHTS RESERVED — Midtown Tulsa Housing Market Analysis – March 2021
____________________
Furthermore, if you are interested in selling your midtown Tulsa home and choose to list with Debbie, she will provide a detailed analysis of the market in your neighborhood or school district so that you can decided the best list price for your home, so it will sell.


Comments(4)