Here is a look at the Broken Arrow, OK housing market as of April 25, 2021.

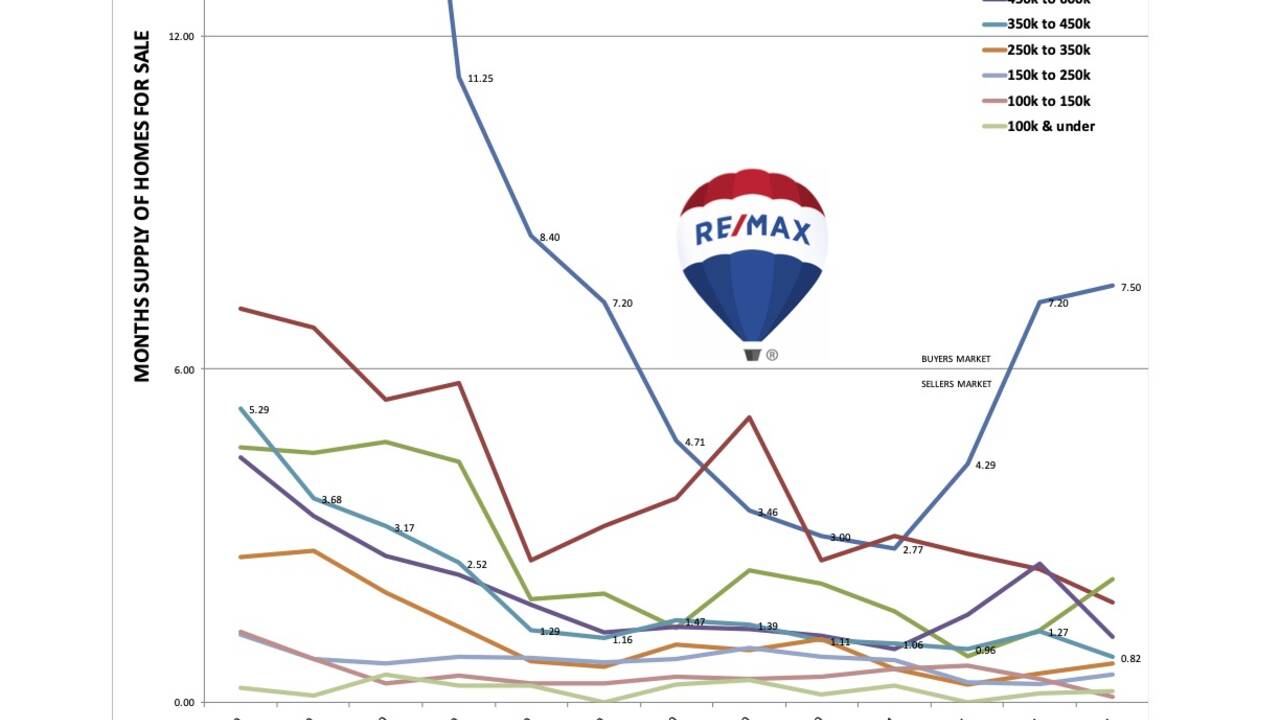
The following graph shows the change in the 3-month absorption rate over the past twelve months for single-family homes (i.e., houses) in Broken Arrow, OK.

This article is a real estate market analysis for single-family homes in Broken Arrow, Oklahoma for the period from January 25, 20201 through April 25, 2021. It is an analysis of trends and shifts in the real estate market for houses in the City of Broken Arrow together with the Broken Arrow Public School District since the previous month (March 2021).
This post is a study of the supply and demand for single-family homes, an analysis of the housing market for houses, using MLS statistics for houses (single-family homes) to show:
- the hotness index for houses, calculating the ratio between pending and active MLS listings;
- the velocity of the real estate market, showing how many houses are selling each month
- the 3-month absorption rate, showing the current supply of houses on the market or how long it will take to sell all the houses currently on the market (assuming no other single-family homes come on the market);
- the odds of selling over the next 90 days, using the absorption rate and comparing it to all the rooftops in the market (the active, pending, closed, expired, released and withdrawn listings in the MLS).
This analysis will show the market trends in order to spot shifts in the market. Graphs show the change in the 3-month absorption rate and show whether a particular price point is in a buyer’s market or a seller’s market.
Methodology
Each month on the 25th I pull CMAs and then plug the data into a spreadsheet so that I can look at the real estate market at various price points and see how it is doing by comparison to the previous month. I then have my husband graph the change in the 3-month absorption rate.
How does one define “Broken Arrow?” It can be the Broken Arrow Public School District OR it can be the City of Broken Arrow with zip codes 74011, 74012 or 74014.
The Broken Arrow area covered therefore includes single-family houses located in the City of Broken Arrow (Broken Arrow, Union, and Bixby Public School Districts) AND The City of Tulsa in Broken Arrow Public School District.
When it comes to houses in Broken Arrow here is what I discovered:
Broken Arrow Houses at All Price Points
In Broken Arrow there are 87 active listings and 404 pending listings, giving us a “hotness index” of 464.37%.
With 610 listings sold in the last three months, there is a sales velocity of 203.3 homes sold per month. The resulting 3-month absorption rate for all price points is 0.43 months. That is a two-week supply of houses for sale in Broken Arrow.
With 1,173 total houses in the market (active, pending, closed, expired, released and withdrawn listings), the odds of selling a house in Broken Arrow within the next 90 days are 52.00%. Those odds are just a bit lower than last month (53.43%).
Broken Arrow Houses Priced Up to $100,000
In Broken Arrow at the price point under $100,000 there are no active listings and 3 pending listings, giving us a “hotness index” of greater than 300.00% (it really cannot be calculated).
With 6 listings sold in the last three months, there is a sales velocity of 2.0 homes sold per month. The resulting 3-month absorption rate for the price point under $100,000 is 0.00 months. That is no supply of houses in Broken Arrow that are priced under $100,000.
With 10 total houses in the market (active, pending, closed, expired, released and withdrawn listings) in the price point below $100,000, the odds of selling a house in Broken Arrow within the next 90 days are 60.00%. These odds are better than last month (54.55%).
Broken Arrow Houses Priced from $100,000 to $150,000
In Broken Arrow at the price point ranging between $100,000 and $150,000 there are 4 active listings and 28 pending listings, giving us a “hotness index” of 700.00%.
With 56 listings sold in the last three months, there is a sales velocity of 18.7 homes sold per month. The resulting 3-month absorption rate for houses in the price point ranging between $100,000 and $150,000 is 0.21 months. That is a 1-week supply of houses selling between $100,000 and $150,000.
With 102 total houses in the market (active, pending, closed, expired, released and withdrawn listings) in the price point between $100,000 and $150,000 the odds of selling a house in Broken Arrow within the next 90 days are 54.90 %. These odds are better than last month (52.94%).
Broken Arrow Houses Priced from $150,000 to $200,000
In Broken Arrow at the price point ranging between $150,000 and $200,000 there are 8 active listings and 115 pending listings, giving us a “hotness index” of 1437.50%.
With 162 listings sold in the last three months, there is a sales velocity of 54 homes sold per month. The resulting 3-month absorption rate for houses in the price point ranging between $150,000 and $200,000 is 0.15 months. That is less than a week’s supply of houses selling between $150,000 and $200,000.
With 294 total houses in the market (active, pending, closed, expired, released and withdrawn listings) in the price point between $150,000 and $200,000 the odds of selling a house in Broken Arrow within the next 90 days is 55.10%. These odds are not as good as last month (60.64%).
Broken Arrow Houses Priced from $200,000 to $250,000
In Broken Arrow at the price point ranging between $200,000 to $250,000 there are 11 active listings and 98 pending listings, giving us a “hotness index” of 890.91%.
With 131 listings sold in the last three months, there is a sales velocity of 43.7 homes sold per month. The resulting 3-month absorption rate for houses in the price point ranging between $200,000 to $250,000 is 0.25 months. That is a week’s supply of houses selling between $200,000 to $250,000.
With 253 total houses in the market (active, pending, closed, expired, released and withdrawn listings) in the price point between $200,000 to $250,000 the odds of selling a house in Broken Arrow within the next 90 days is 51.78%. These odds are not as good as last month (54.76%).
Broken Arrow Houses Priced from $250,000 to $300,000
In Broken Arrow at the price point ranging between $250,000 to $300,000 there are 14 active listings and 50 pending listings, giving us a “hotness index” of 357.14%.
With 98 listings sold in the last three months, there is a sales velocity of 32.7 homes sold per month. The resulting 3-month absorption rate for houses in the price point ranging between $250,000 to $300,000 is 0.43 months. That is a two-week’s supply of houses selling between $250,000 to $300,000.
With 173 total houses in the market (active, pending, closed, expired, released and withdrawn listings) in the price point between $250,000 to $300,000 the odds of selling a house in Broken Arrow within the next 90 days is 56.65%. These odds are better than last month (52.32%).
Broken Arrow Houses Priced from $300,000 to $350,000
In Broken Arrow at the price point ranging between $300,000 to $350,000 there are 14 active listings and 54 pending listings, giving us a “hotness index” of 385.71%.
With 68 listings sold in the last three months, there is a sales velocity of 22.7 homes sold per month. The resulting 3-month absorption rate for houses in the price point ranging between $300,000 to $350,000 is 0.62 months. That is a three-week’s supply of houses selling between $300,000 to $350,000.
With 143 total houses in the market (active, pending, closed, expired, released and withdrawn listings) in the price point between $300,000 to $350,000 the odds of selling a house in Broken Arrow within the next 90 days is 47.55%. These odds are not quite as good as last month (48.76%).
Broken Arrow Houses Priced from $350,000 to $400,000
In Broken Arrow at the price point ranging between $350,000 to $400,000 there are 10 active listings and 27 pending listings, giving us a “hotness index” of 270.00%.
With 53 listings sold in the last three months, there is a sales velocity of 17.7 homes sold per month. The resulting 3-month absorption rate for houses in the price point ranging between $350,000 to $400,000 is 0.57 months. That is a two-week’s supply of houses selling between $350,000 to $400,000.
With 96 total houses in the market (active, pending, closed, expired, released and withdrawn listings) in the price point between $350,000 to $400,000 the odds of selling a house in Broken Arrow within the next 90 days is 55.21%. These odds are much better than last month (45.05%).
Broken Arrow Houses Priced from $400,000 to $500,000
In Broken Arrow at the price point ranging between $400,000 to $500,000 there are 12 active listings and 25 pending listings, giving us a “hotness index” of 208.33%.
With 48 listings sold in the last three months, there is a sales velocity of 16.0 homes sold per month. The resulting 3-month absorption rate for houses in the price point ranging between $400,000 to $500,000 is 0.75 months. That is a three-week’s supply of houses selling between $400,000 to $500,000.
With 93 total houses in the market (active, pending, closed, expired, released and withdrawn listings) in the price point between $400,000 to $500,000 the odds of selling a house in Broken Arrow within the next 90 days is 51.61%. These odds are much better than last month (55.71%).
Broken Arrow Houses Priced from $500,000 and Above
In Broken Arrow at the price point ranging from $500,000 and above there are 17 active listings and 19 pending listings, giving us a “hotness index” of 111.76%.
With 9 listings sold in the last three months, there is a sales velocity of 3.0 homes sold per month. The resulting 3-month absorption rate for houses in the price point ranging from $500,000 and above is 5.67 months. That is a 24-week supply of houses selling above $500,000.
With 51 total houses in the market (active, pending, closed, expired, released and withdrawn listings) in the price point from $500,000 and above the odds of selling a house in Broken Arrow within the next 90 days is 17.65%. These odds are not as good as last month (27.03%).
Debbie Durkee can send you the raw data that went into the above market analysis. The data comes from what we call a comparative analysis.
Helpful Links
To search for homes for sale (single-family houses for sale) in Broken Arrow Schools, go to Homes for Sale in Broken Arrow Public Schools
____________________
Copyright © 2021 Deborah M. Durkee. ALL RIGHTS RESERVED — Broken Arrow Housing Market Analysis – April 2021
____________________
Furthermore, if you are interested in selling your Broken Arrow home and choose to list with Debbie, she will provide a detailed analysis of the market in your neighborhood or school district so that you can decided the best list price for your home, so it will sell.


Comments(2)