A Modest Easing for Unit Sales; With Sales Price Up Slightly for Vancouver WA Condos in August 2021.
Although Unit's Sold eased from last month, they posted the Second-Highest number we've recorded ever. Prices stopped their slide, and the short-term trend is matching the rise of the long-term trend-line. Active Inventory remains stubbornly below one-month's worth of Supply. Here are the key points for this month:
- The Short term Condo Sales Price (3-Month Moving Average) gained just under $5k and is now at $329,533; which is up 4.99% compared to the prior August; and the 12-Month Moving Average is at 11.78% compared to the prior year;
- 82 Resale Condominiums were sold, which is up 28 units compared to August 2020, and 9 fewer than last month;
- REO/Bank Owned Condominium sales came in at 2 units (2.44% of total); up from 0 (0% of total) in August 2020.
- Short Sale /Pre-Foreclosure property sales were 0 units (0% of total); no change from 0 (0% of total) in 2020.
Next up we have my custom chart illustrating the Unit-Sales for the Vancouver Condo market Units-Sold trends - both short-term and long-term:
 Vancouver WA Resale Condo Sales - Units Sold Trend August 2021
With two of the highest-ever one-month posting for unit-sales, the short-term trend is still moving up strongly; with the long-term trend at a new high but showing signs of slowing.
Moving along we have my custom chart for the Average Sales Price, showing both the short-term and long-term trends:
Moving along we have my custom chart for the Average Sales Price, showing both the short-term and long-term trends:
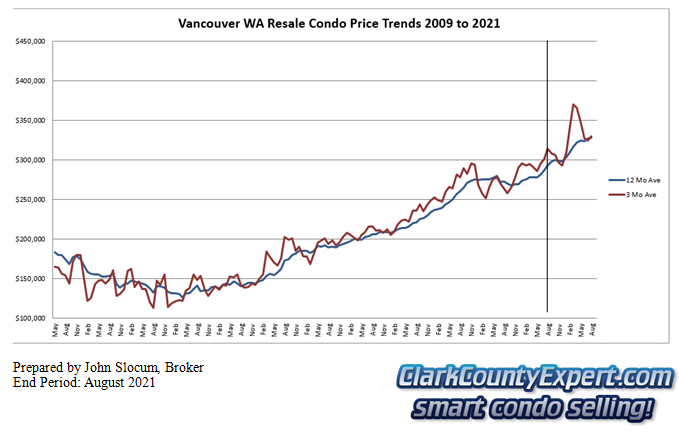 Vancouver WA Resale Condo Sales - Average Sales Price Trend
The short-term line has stopped its sliding and is now essentially matching the long-term line. Given the strength of the overall housing market we did not expect much more in the way of negative movement in this indicator at this time.
The final charts for this report show Unit Sales, Average & Median Prices; and Days on Market results (from RMLS chart-tools):
 Vancouver Condo Sales Inventory & Days on Market Trends
Inventory-by-Month shows New Listings and Pending Sales both declining and ending near the same mark; with Closed Sales also declining but ending at a higher mark than the other two.
The middle graph shows Closed Sales Prices slightly down from last month; with New Listings Average Price higher than the Closed price level.
The final graph shows a 4-Day increase in the Average Days on Market; with the Median Days on Market moving up 1 day. The market is still quite brisk by historical standards but currently we may be starting to see some slowing.
Thank you for viewing our Condos Sales Report for Vancouver WA. We'll be glad to answer your questions or comments on this type of home; and would love to assist you in Selling or Buying your Condo!
Like to see more like this? Then you might like:
Real Estate in Vancouver WA - August 2021 Report
PS - We love to help Condo Owners Sell their home. This market segment is still very popular, and now is a great time to call to get started with a Market Value for your Vancouver WA Condo, and to learn more on how the sales process works in this fast-paced market.
PPS - I also love to help Condominium Buyers! Contact us at your earliest convenience and discuss your interests and timing. We'll be glad to set you up with an Automated Search program in RMLS or, you August visit the Condominiums For Sale in Vancouver WA page at our website, where we have endeavored to make it Easy for you to search by Neighborhood for Condos, with listings for condos from the entire RMLS. Some of the favorite Neighborhood Searches include Condominiums for sale on the Vancouver WA Waterfront; Condominiums for sale in Downtown Vancouver Washington, Vancouver Washington Luxury Condominiums for sale.
The statistical charts for Vancouver WA Condos in this report (prepared by Vancouver WA Condo Specialist Broker John Slocum, our resident statistician) are based on condo sales recorded in the Vancouver MLS system (RMLS), excluding sales of newly constructed condos; and shows the purchase activity since 2009; charting the 3 month Moving average number of sales, and the 12 month Moving average. The "smoothing" of the relatively sparse-data helps to better illustrate the short-term and longer term trends in Vancouver's Condominium market.
Disclaimer: as with all real estate statistics, we do our best to provide the best representation at the time the data was acquired. We deem the data and reports reliable but not guaranteed.


Comments(3)