What a roller coaster! January started out unlike the regular seasonally slow housing market. Active listings took a nose-dive while sales picked up! Active listings here dropped considerably as compared to January 2021.

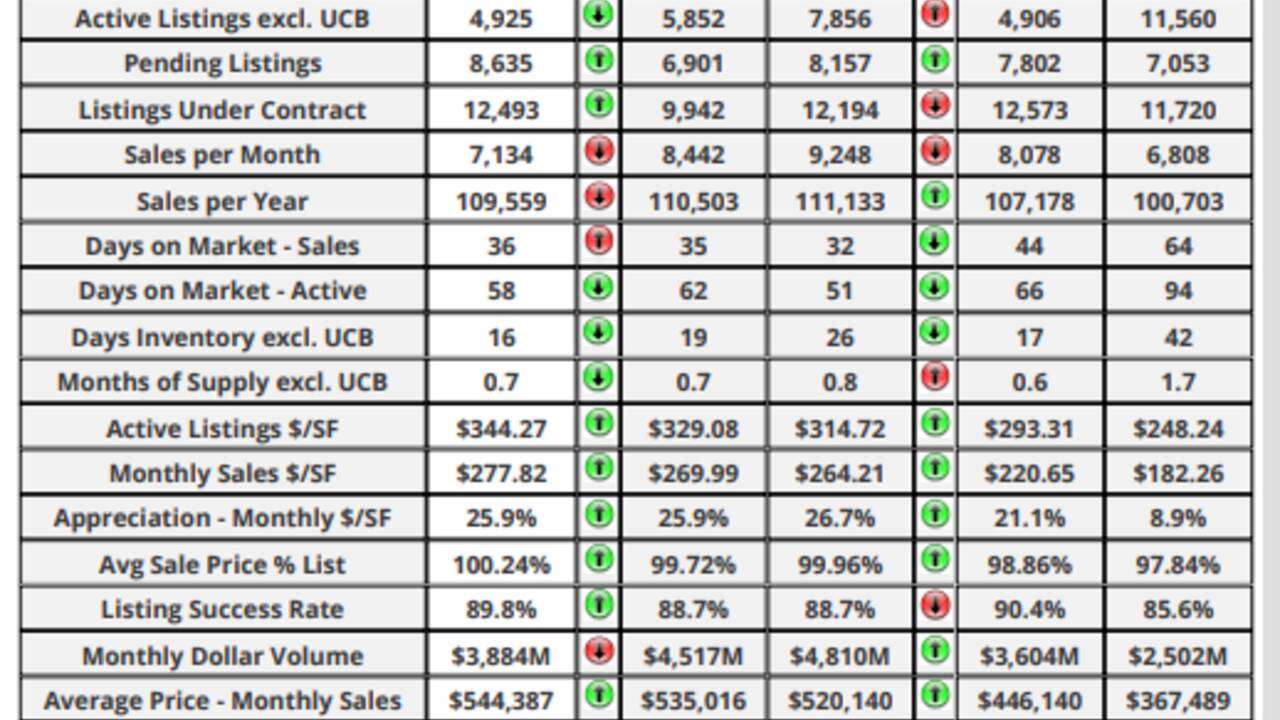
Notice that days on market have ticked upward slightly and are currently 35, among the fastest in the country. Even though days on market ticked upward, sales remain unaffected in Maricopa County due to demand and low inventory.

Prices are still rising. Year over year, Median Sales Prices have risen from $350,000 to $445,000, a 21% increase in prices. Median Sale Prices are achieved by removing the very high and very low prices. Average Sales Prices aren't used as that's not as realistic for reporting; that method includes the sale of a $21,500,000 home!

If all things remained the same for listings and no new homes were entered on the market for sale, it would take 16 days to sell everything on the Arizona Regional MLS! That's a drastic change from the Housing Recession of 149 days. The other peak was March 29, 2014 with 115 Days of Inventory. The lowest valley in the chart was March 6, 2021 at 15 days.

The interesting aspect of appreciation is shown here by price range. The highest appreciation is in the range of $225,000 to $500,000. Those ranges would be considered affordable housing. Thus home buyers that didn't purchase/win housing bidding wars, are being priced out of the housing market.

If you're interesting in buying and selling real estate, make sure to use a competent, knowledgeable real estate professional.


Comments(2)