I've recently provided a copy of this report to our local officials for the City of Temecula. This information may prove helpful in determining city budget forecasts for the coming year as they evaluate the impact the downturn in our housing market has had on their revenue stream.
Of course property tax revenue is just one source of income for the city but a major one. As the state continues to wrestle with a budget that may or may not include some trade-off between property taxes and vehicle license fees, a city like Temecula that is approaching residential build-out needs to know where current property values are.
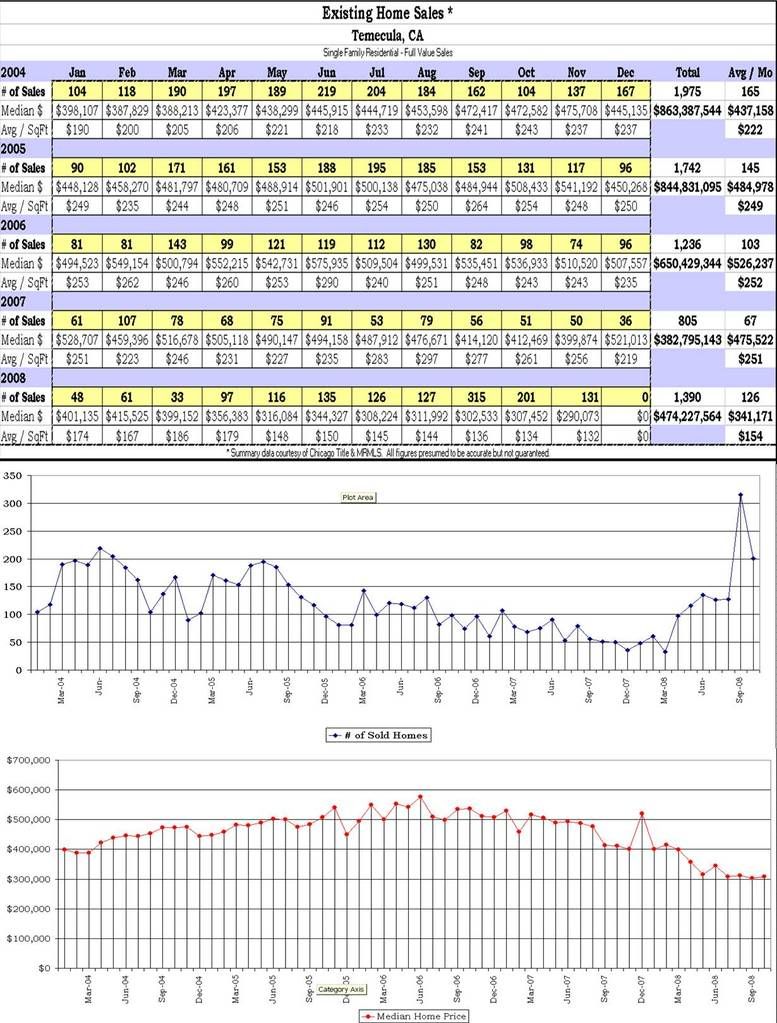
As you look at the attached chart and graphs, you will notice that the number of sales has declined steadily through 2007 while median values continued to grow through 2006. Total home sales value peaked in 2004 at more than $863 million dollars with 1,975 homes sold, a number that fell to just $382 million in 2007 with just 805 homes changing hands.
Spurred by declining values, a surplus of inventory to choose from and attractive interest rates, sales rebounded in 2008 to post a volume nearly double the number sold in 2007. But the decline in the median price of a home will leave the city nearly 40% off the peak revenue pace of 2004, nearly $375 MILLION. Couple that decline with the reduced revenue from Proposition 8 mandated property tax reductions for existing homeowners and you understand why Temecula is looking at alternative revenue sources and holding the line on expenses for 2009.
By tracking these numbers an investor or prospective homebuyer can determine where they think the market is. As I pointed our last August, one month of sales increase doesn't mark a trend. But as sales volumes continue to grow that will lead to the continued absorption of our excess inventory, the return to a more stable market and the end of the rampant price declines - 35% in just the past year. I am expecting to start seeing that stability develop by late 2nd to early 3rd qyarter this year in our local market, possibly sooner depending on mortgage interest rates and federal stimulus incentives. Subscribe for your own market updates by clicking the link at the bottom of this page and let me know what you think is happening.


Comments(3)