I am always asked when is the best time to list a home in London Ontario or how is real estate doing and what are the average prices. I also hear most excuses why homes do not sell or the rationalization of why some homes sell quicker than others and some, for more money.
Understanding the local market and facing the reality of the local market can be a double edged sword for many London home owners. Selling your home is not a lottery, or a gosh by golly whim, or just putting up a sign on your lawn or pricing your home because one of your co-workers and one of your friends told you your home is worth ‘x’, because they sold their home last year and know of a friend of a second cousin who has a friend who used to sell real estate part time. (whew!)
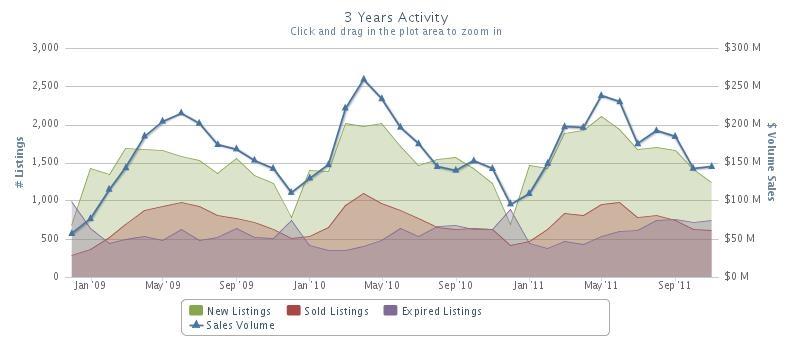
Below is a 3 year chart and graph of ACTUAL home sales in London Ontario and as history has a way of repeating itself, what is in store for 2012?
I cannot predict the future as I prefer to live in the moment and my experience reasons ;that a home will sell based on price, location and the amount of listings there are that compete with your home. Mr. and Mrs. Buyer decide that, not you.
|
As of November 30, 2011 |
2011 |
2010 |
2009 |
%INC/DEC |
|
[ 2010 - 2011 ] |
||||
|
Total # of Listings [Month] |
1233 |
1228 |
1232 |
0% |
|
Total # of Listings YTD |
18402 |
17704 |
16325 |
4% |
|
Total # of Expired Listings [Month] |
739 |
622 |
510 |
19% |
|
Total # of Expired Listings YTD |
6384 |
5739 |
5883 |
11% |
|
Total # of Sales [Month] |
610 |
628 |
621 |
-3% |
|
Total # of Sales YTD |
8218 |
8348 |
8157 |
-2% |
|
Total Sales Dollar Volume [Month] |
$144,645,479 |
$141,887,190 |
$142,657,385 |
2% |
|
Total Sales Dollar Volume YTD |
$1,954,013,464 |
$1,939,169,178 |
$1,775,654,596 |
1% |

Comments(2)