The housing markets in most of these cities missed the bubble and bust altogether, and home prices continued to climb steadily after the national market went bust. These cities have diversified their economies, enjoy rising population and job growth, and have relatively low rates of unemployment and foreclosure.
The cities on this list that did go bust, such as Cape Coral, Fla., are beginning to recover, although home prices may still be bouncing around the bottom as buyers (particularly investors) dash in to nab bargains. The likelihood of continued double-digit price increases is slim, especially as more foreclosures come to market.
All of the metropolitan areas we've ranked have a population of at least 200,000. Change in home prices reflects the one-year period through September 30, 2011, when the national average was -2.6% and the median home price was $171,250. We also report the change since the national peak in home prices, in the second quarter of 2006. Sales and inventory numbers were drawn from the most current market reports (October or November 2011). Unemployment rate is as of October 2011, when the national average was 8.5%. Foreclosure rate is as of September 30, 2011, when the national average rate was 1 of every 213 housing units, or 0.47%.
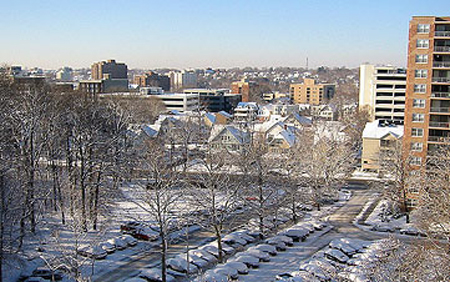
5. Rochester, N.Y.
One-year change in home prices: 7.1%
Median home price: $114,900
Change in price since peak: 6.7%
Unemployment rate: 6.7%
Foreclosure rate: 1 of every 2,220 housing units (0.05%)
 |
Rochester, headquarters of flailing Kodak, is another of those well-kept secrets of upstate New York. Or, as one local real estate agent says, "It gets a bad rap for the lagging upstate economy, job layoffs and snow, but once people come, they don't want to leave."
Sales rose during the past year, inventory fell to 4.5 months supply -- balanced between buyers and sellers -- and home prices grew more during that time than they did in the six years since the local housing market's peak. Unemployment is relatively low, and foreclosures are hard to find.
4. Utica-Rome, N.Y.
One-year change in home prices: 8.8%
Median home price: $94,700
Change in price since peak: 16.2%
Unemployment rate: 7.1%
Foreclosure rate: 1 of every 9,757 housing units (0.01%)
 |
While the national housing market ran like the hare, Utica (and most of upstate New York) plugged along like the tortoise, with slow and steady home-price increases and no lending or speculative bubble. Its rate of foreclosure is minuscule, and unemployment stands below the national average. Prices have seen a bump up in the past year along with increased sales.
3. Ann Arbor, Mich.
One-year change in home prices: 9.4%
Median home price: $185,000
Change in price since peak: -28.6%
Unemployment rate: 5.7%
Foreclosure rate: 1 of every 196 housing units (0.51%)
 |
It's all good in Ann Arbor, which boasts the lowest rate of unemployment and the highest per capita income in Michigan. It also has a moderate rate of foreclosure and an accumulation of "best city" accolades.
Sales have been stable, single-family homes have been selling fast (71 days on the market in November), and the months' supply of homes is at the high end of balanced between buyer and seller.
2. Bridgeport-Stamford, Conn.
One-year change in home prices: 10.0%
Median home price: $497,500
Change in price since peak: -56.9%
Unemployment rate: 7.8%
Foreclosure rate: 1 of every 502 housing units (0.20%)
 |
Even though the median home price here approaches $500,000, that's less than half of the price at the peak. And that counts as vastly improved affordability for the residents of tony Fairfield County, home to investment management companies and hedge funds, where the median household income is nearly $80,000.
Sales through June 2011 were up by about one-fifth from the year earlier, before falling somewhat in the traditionally slower fall months, and inventory stands at about eight months' supply, still a buyer's market. The rate of foreclosure is low, but job growth needs to improve to shore up buyer confidence and demand.
1. Cape Coral-Ft. Myers, Fla.
One-year change in home prices: 12.1%
Median home price: $100,000
Change in price since peak: -63.4%
Unemployment rate: 10.7%
Foreclosure rate: 1 of every 92 housing units (1.09%)
 |
Cape Coral epitomized the housing boom and bust, so it's a shocker to see it rank first among cities where prices have risen most. That's especially true given that the rates of unemployment and foreclosure remain high and distressed properties still constitute half of all sales in the metro area, which ordinarily would exert downward pressure on demand and prices.
Sales in this appealing area, with its 400 miles of waterways and access to the Gulf of Mexico beaches, islands and fishing grounds, are steady (and traditionally rise with the arrival of winter snowbirds). The region has just four months' supply of homes for sale, but that figure varies greatly by locale and property type (for example, from less than a month's supply of single-family homes in Lehigh Acres to a year's supply of condos in Ft. Myers Beach).

Comments (0)Subscribe to CommentsComment