I have been having an ongoing discussion with some of my fellow real estate professionals that this is not the normal housing recovery. I believe that we are seeing a supply/demand shortage of housing, especially in California. Families are being out bid by investors, and some of the investors are buying 100's of homes in low to moderate income areas. But we are not seeing the building we need to supply the demand for low and moderate income families. What is stopping construction is the inability to get construction loans, the fees and regulation nightmare of many cities and counties, and the fear for developers to put their own money in harms way!
Below is a great piece on subject from Dr. Housing Bubble.com It is a well written article and has some great charts.
Perceptions are guided by recent events. History is easily forgotten and our hardwiring makes us prone to trend following. The housing boom that started in 2012 is still the story today. In 2012 I noticed on various forums that new housing related shows were on the uptick. The headlines were largely positive. It is hard to see how the pace of appreciation can continue without a similar underlying real growth in household wages or a continued flood of investor money. Yet in markets were investors dominate, local families are outbid by global money and big funds. What makes up a healthy housing market? Today we’ll examine seven charts and try to put this current housing market into a longer-term perspective.
Normal housing market
There are many factors to examine when it comes to a normal housing market. I would argue that it is more important to focus on having a healthy economy and allowing housing to follow instead of focusing on housing and expecting the economy to follow. For over a decade the focus has been on housing and the Fed with QE3 is not disrupting that trend. Trulia has an interesting barometer on a few key housing metrics:
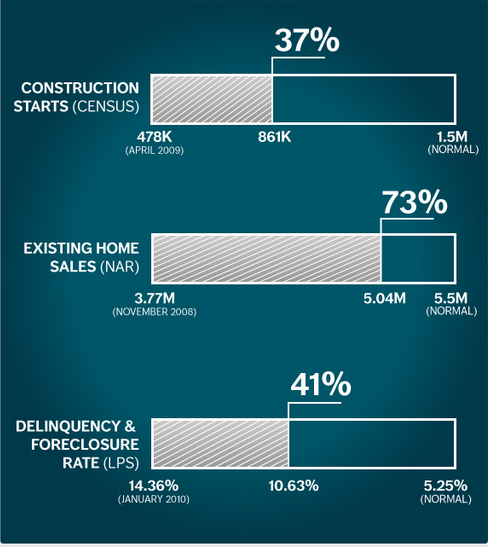
Source: Trulia
According to the above barometer, a normal market would have 1.5 million construction starts. We are at 861k. We’re making progress here but still a good distance from 1.5 million. The next item is existing home sales. We’re at 5.04 million whereas a more normal market would be at 5.5 million. On this metric we are inching closer to a more normal market. The number of mortgages in some sort of distress is up to 10.63 percent. This is still very high compared to the normal rate of 5.25 percent.
Low inventory
The number of homes for sales is extremely low:
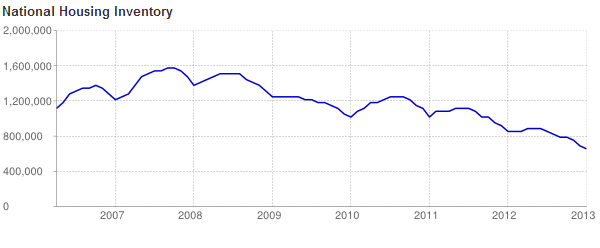
While existing home sales are still short from a more normal level (not by much) housing inventory on the other hand is down by record levels. At a certain point you would expect this to carry over into housing starts and we are seeing this occur.
Housing starts
Housing starts are definitely on their way up. This should be expected given the very low inventory. Yet as we have discussed in previous articles, many younger Americans are saddled with high levels of college debt and are looking for lower priced housing options. In 2012 31 percent of housing starts were for multi-unit properties. Stronger rental demand but also, the new clientele base is likely pushing this trend.
30 year fixed rate mortgage
The drop in interest rates is truly historical:
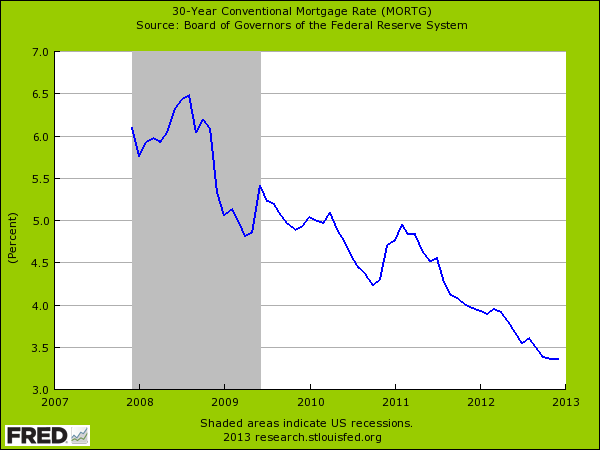
People calmly talk about this as if we have a historical reference point for this. We do not. The Fed now has a balance sheet that is well over $3 trillion. This is not normal either:
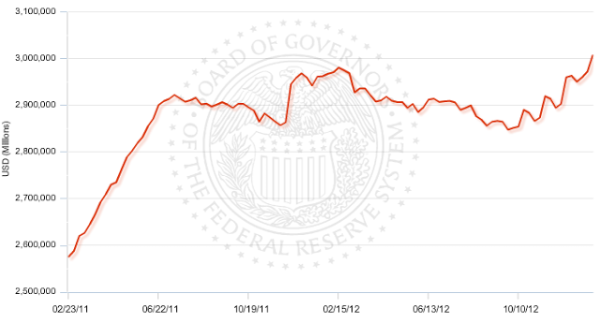
Fed’s balance sheet as of 1/16/13 (source: FRB)
Prior to the recession, the Fed balance sheet was well under $1 trillion. We are a very long way from that and the Fed with QE3 is basically eating up MBS from the market. It is interesting that some would like to discount this activity yet the Fed is dictating interest rates and is the major player in the mortgage market. In other words, the Fed is the housing market.
Construction jobs
Now this is a trend that I found interesting. While housing starts are up, construction jobs are still lagging:
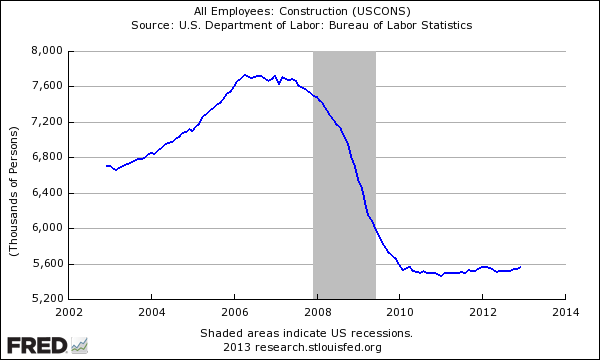
What is going on here? Is it because multi-unit properties require less labor? I doubt it. Are construction crews making due with less? That could be one reason. This is probably one of the more interesting trends here. In this category we are also very far away from a normal market.
China wages
In a global system inflation can be exported. While US wage growth is anemic and inflation adjusted household income is now back to levels last seen in the 1990s, wage growth in China is definitely occurring:
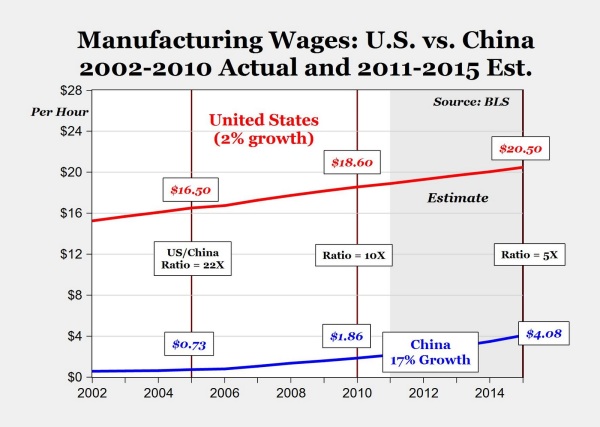
It should come as no surprise then that money is rushing back into places like California and Canada propping up prices in select areas. Foreign demand is incredibly strong as the wealthy class rises abroad. In an open market, money can travel as it sees fit. Inflationary pressure is charging back in.
Part-time workers
Another trend we are facing is the growth of a permanent part-time workforce. Many workers now work under contracts or projects. This is another reason why we have seen the U6 unemployment figure remain high:
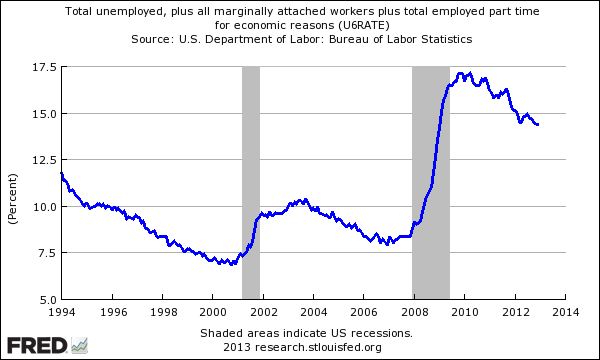
This is unlikely to be positive for wage growth but does help companies earn more as they slash costs. It also makes a tougher case for sustained home value growth. The last few years have seen a large amount of buying come from investors. Nearly one third of all sales were investor based. This is incredibly high. It is hard to find historical data on a normal figure here but I would venture to guess that it is around the 10 percent range for the nation. In California, foreign demand makes up this portion alone:
“(OC Register) The National Association of Realtors estimated that foreign buyers accounted for 11 percent of California home sales.
The California Association of Realtors, however, pegged foreign sales at 5.8 percent of the state’s transactions. Of those, 39 percent of the buyers come from China, followed by buyers from Canada (13 percent), and from India and Mexico (8.7 percent each), CAR reported.”
Last month over 33 percent of buyers in Southern California paid all cash for their purchases, tying a previous historical record set a few months ago. The monthly average since 2000 is closer to 17 percent so we are nearly double that.

Comments(2)