To succeed in content marketing, you have to have drive, ambition, adaptability, and a strong understanding of Google Analytics. Understanding how, when, why, and what device users employ to view your site gives you the key to boosting conversion and generating new traffic. Not all Google Analytic reports were created equal. Here are the top five that make up Marketing 101.
The mobile performance report
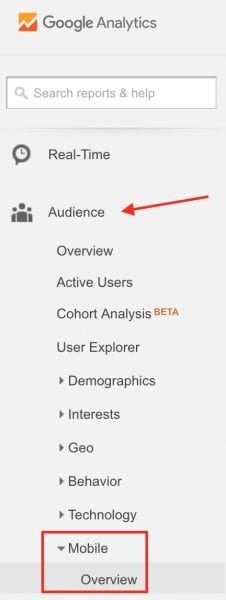 First, select ”audience,” then ”mobile,” and then ”overview,” and take a look at your mobile performance report. In a content marketing climate where more brands are creating mobile-only content, getting your mobile site perfect should be top priority. If your site is underperforming across mobile platforms it could badly effect your bottom line.
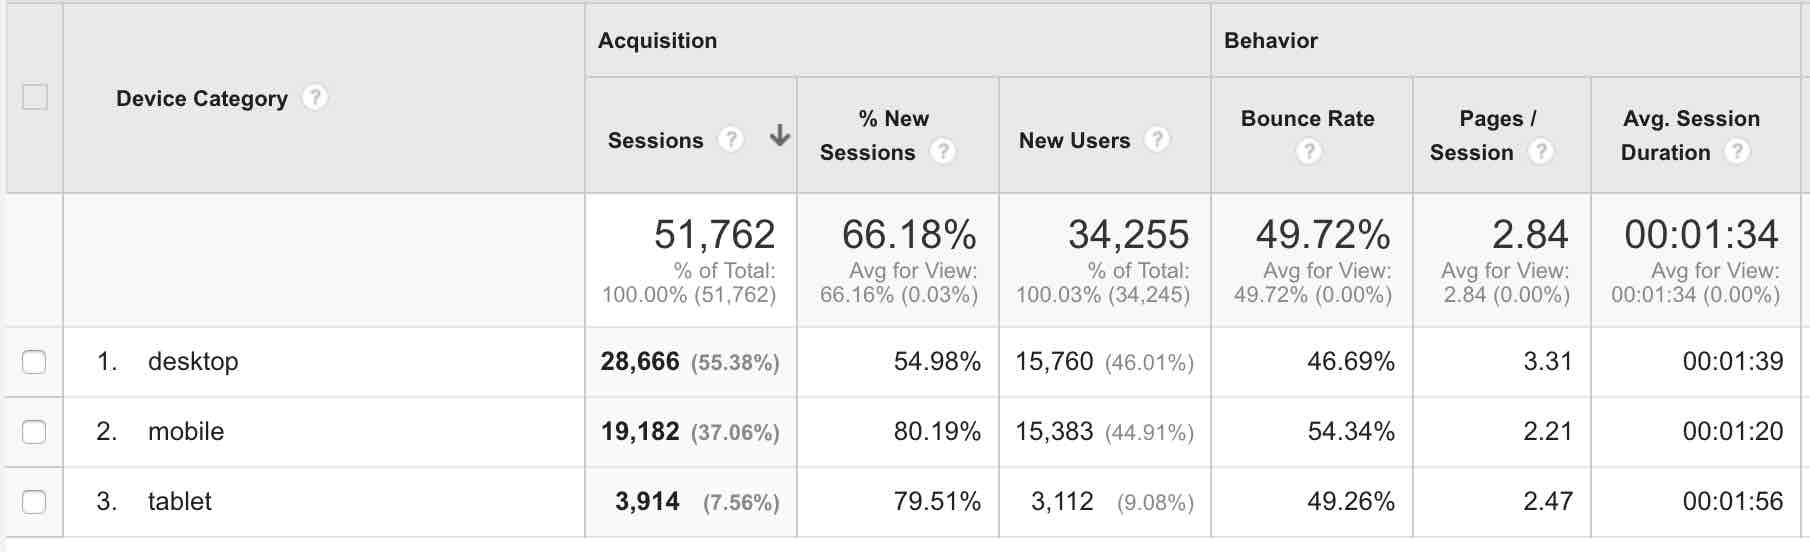
You can view many device categories at once. You should pay a lot of attention to bounce rates and user times. If your site isn’t fully optimized for tablets, for example, you’ll notice that tablet users are going to bounce in much higher numbers than the rest of your business.
First, Compare your 3 devices in the report. You are looking for anything that stands out and surprisingly different than the others. In the sample report below, you’ll notice tablet has slightly higher bounce rate than mobile, and mobile, a bit higher than desktop. There is nothing startling here, just worth reviewing. Page Sessions on mobile devices are a bit lower than desktop on this report and average sessions are all in the same general area. This is going to be a pretty standard report.
If you notice, however, that your mobile bounce rate is much higher and your avg. Session Duration is much lower, and pages viewed are lower, you may need to put some work into your mobile website.
Sample Google Analytics Mobile Overview Report:
Traffic acquisition report
This is a key report for anyone focusing on generating leads from the web. In order for your website to bring in leads, it must first bring in traffic. This report will show you where your traffic is coming from.
Select ”acquisition” and then ”overview’.” This master report can be broken down several ways, each of which gives different important information.
You can view which channels are sending you traffic. View the sessions and new sessions, new user, bounce rate per channel, Pages and Avg. Session Duration per channel. Click on any of the channels to drill down more specifically. In this case, you can see that the lowest bounce rate and highest sessions and highest Avg Session Duration on this website is Referral Traffic. This would indicate Referral Traffic being a very strong source of traffic. These Referrals are basically links coming in to this site from other sites. These could be websites also owned by the same website owner, they could be blog sites, or classified sites, or news sites, anywhere that has a link back. To drill down and see what your referral traffic is, you would click on Referral to view each referral one by one.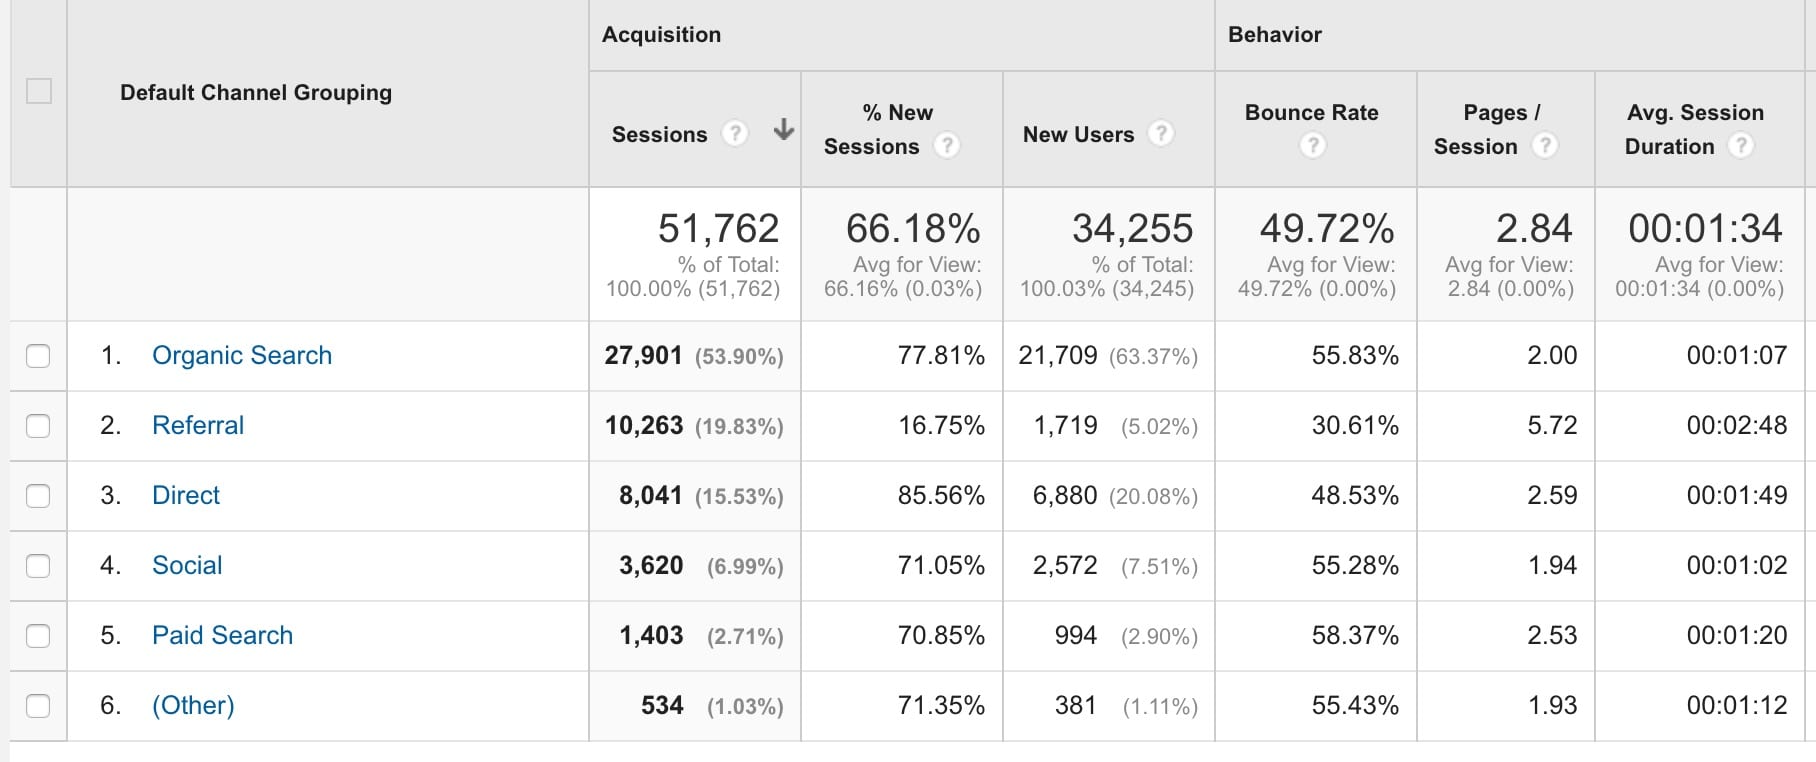
Check which external sites are getting you the most hits. From there, you can break it down to be even more specific: which blog posts get the most traffic? Which YouTube videos are paying dividends? This specific information will allow you to watch different SEO tactics compete in real time. If Batch A blog articles written in one strategy get a lot of traffic at first but then drop off, while Batch B blog articles written with a different strategy are bringing in the hits consistently, you know what you have to do to get long-term, maximum investment from your efforts.
You might also like: How to Generate Leads From your Real Estate Website
Keyword analysis report (queries)
 SEO has gotten harder to implement. Google started encrypting some search data in 2012, and since then marketers have been working hard to fill those gaps. Not every keyword is encrypted, and you can still build a solid, marketable strategy around those that are not. Encrypted basically means, we can’t see most of the keywords people use to find our website anymore.
The data you can see, you must really focus on and expand on. It tells a story.
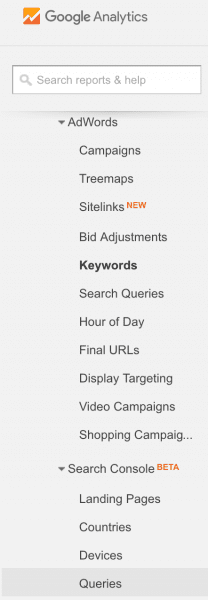
Formally known as Google Webmaster Tools, Search Console provides sample data of “queries” (keyword phrases) people have used to find your website. If you have set up your Search Console, you will see a section inside your Google Analytics that says Search Console and you can click on queries to view this report. If you are doing any kind of SEM (Search Engine Marketing) or PPC through Google AdWords, you will see keywords used in this area as well.
You might also like: Website Analytics Tools | Demystifying Google Search Console
And also along the same lines: Getting Started with Google AdWords – Pay Per Click Advertising PPC
The difference between a bounce and an exit rating
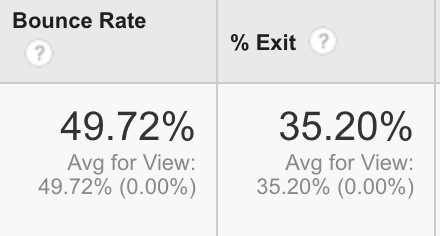
When visitors view your page and leave your site without clicking on anything else, they’ve “bounced” from your site. There are many reasons for this, some of which are beyond your control. They came in by an obscure keyword and didn’t know what to do. Perhaps your site isn’t mobile optimized and they had trouble viewing it. Perhaps your layout was too difficult to read, too distracting, or too ugly. Regardless the reason, you want the bounce rate to be as low as possible. The longer someone is on your site, the more chances you have to make a sale or generate ad revenue. The exit rate is the rate at which people leave your site after taking action on your site.
When measuring individual landing pages on your site, you’ll be able to see how many entered on particular page and how many exited on that page.
Landing page reports
This is closely linked to the bounce/exit rating. It tells you where your hits are coming from: Google, your social media, your blog (and where they got your blog pages), etc. You can quickly see which content is bringing people in and which landing pages or page types need to be optimized.
When you put these Google Analytics reports together, there’s enough information to fine tune your site into a lead generating, sales making, ad revenue earning machine. Smooth out bad landing pages, work in more hyper-engaging copy, and track your rates of approval over time. These reports will get you there.

Comments(3)