Continued Strong Home Sales for Vancouver WA in September 2019, with Prices Starting Their Seasonal Slide.
Early Fall Home Sales in Vancouver WA came in with another very strong unit-sales posting; while the average sales price has started its expected seasonal slide. Below are the key points for this month:
- 397 Resale Homes closed this month, which is 36 more (9.97%) than this month last year; although 74 fewer than last month.
- The 3-Month Moving Average Price Trend Line eased back from its recent high to $372,614, with a year-over-year gain of 3.02% ; with the 12-Month Moving Average up 4.66%.
- Short Sale /Pre-Foreclosure property sales were 2 units (0.5% of total); no change from 2 in September 2018 (0.54% of total).
- REO/Bank Owned home sales were 1 units (0.25% of total); compared to 1 unit in September 2018 (0.28% of total).
- The Active Inventory for Resale Residential Real Estate slipped 0.4 to a very low 1.4 Months of Supply.
Mortgage Interest Rates again dropped but only slightly, averaging 3.61% for the month, sneaking up on the all-time low. Affordability has been improved with the slowing increase in sales prices, and the lowering of financing costs.
Continuing on, I have prepared custom graphs showing the Number of Homes Sold (Unit-volume) trend, for both short and long term trend lines:
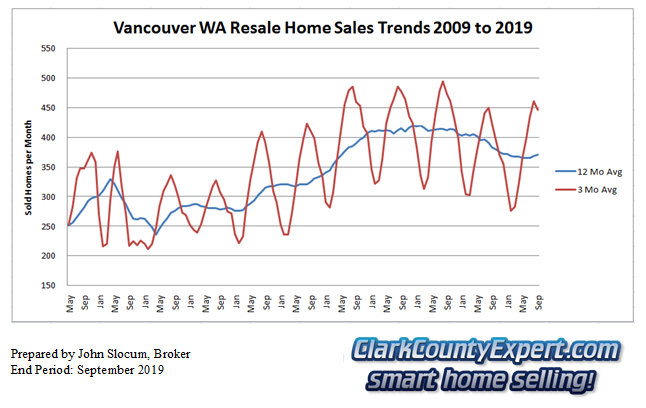 Vancouver WA Resale Home Sales -
Units Sold Trend September 2019
This is the time of the year we see the short-term line retreat from its peak, and make a downward run. However, we also see that the long-term trend has actually moved up from the bottom of its recent trough - confirming that the recent strong sales have some measure of durability to them. With the near-term expectation of low interest rates for home loans we expect the number of sales to remain reasonably strong.
Next we have the Average Sales Price trend-graphs below, with the short-term line easing off from its recent all-time high:
 Vancouver WA Resale Home Sales - Average Sales Price Trend
We've hit another all-time high for prices again this year however, the difference between last year's peak and this year's - the rate of change - is much less than what we've seen in the past. With such a long upwards run in home sales prices, this trend cannot continue indefinitely unless Wage growth keeps up the pace as well - and we don't believe that has occurred.
In September 2019 there were 38 properties (6.6%) that closed at $250,000 or less when sold. In comparison with the same month in 2018, 43 or, 11.91% of the sales were at $250k or below.
Our final charts below come from RMLS, using a mix-mode to highlight home sales results for Unit Sales, Average & Median Prices; and Days on Market:
 Vancouver Resale Home Sales Inventory & Days on Market Trends
In the first graph New Listings, Pending Sales and Closed Sales again showing their typical seasonal retreat.
The middle chart shows Average Prices, with the New List Price jumping up to the highest level seen in the past 12 months; while Closed Sales prices eased to the lowest level in the past 6 months.
Interestingly, both Average Days on the Market and Median Days both decreased by several days each.
Thank you for visiting our home sales report for Vancouver WA. We're happy to help you with any questions, or requests for assistance with your home purchase or sales needs in 2019!
PS - We love to Sell Homes in Vancouver and Clark County Washington. Are you in the market to sell your home? - the first step to take is to ask us to find out what your Home will Sell For. We'll prepare a confidential Market Analysis and Valuation, and a road-map for the Home Selling Process. Give us a Call - we'd love to help you out!
PPS - Home Shopping or, looking to right-size to another Home or Condo? We wouldn't have a real estate market if there weren't home buyers, and we love to help Home Buyers! As a part of our service we make it ease to Search all the available Homes for sale in Vancouver Washington or, separately Search all the available Condos for sale in Vancouver WA. We've put much custom work in to make it Easy for You to search by Neighborhood or by Category, with Homes and real estate listings from the entire RMLS. Sign-up is Not Required but recommended as you can Save your own custom search!
This report and custom charts (prepared by John Slocum Vancouver WA Listing Real Estate Broker, our resident statistician) are based on home sales posted in the Vancouver MLS system (RMLS), excluding sales of mobile home; and shows the purchase activity since 2009; charting the 3 month Moving average number of sales, and the 12 month Moving average. This "smoothing" of the trend-data helps illustrate the short-term and longer term trends in Vancouver WA's real estate market.
Disclaimer: as with any real estate statistics, we do our best to provide the best representation at the time the data was acquired. We deem the data and reports reliable but not guaranteed.


Comments(2)