This is a copy from my personal blog, of a recent post called Another Piece of the Oklahoma Real Estate Puzzle, that I wanted to share here for all the rainers to evaluate. Enjoy!
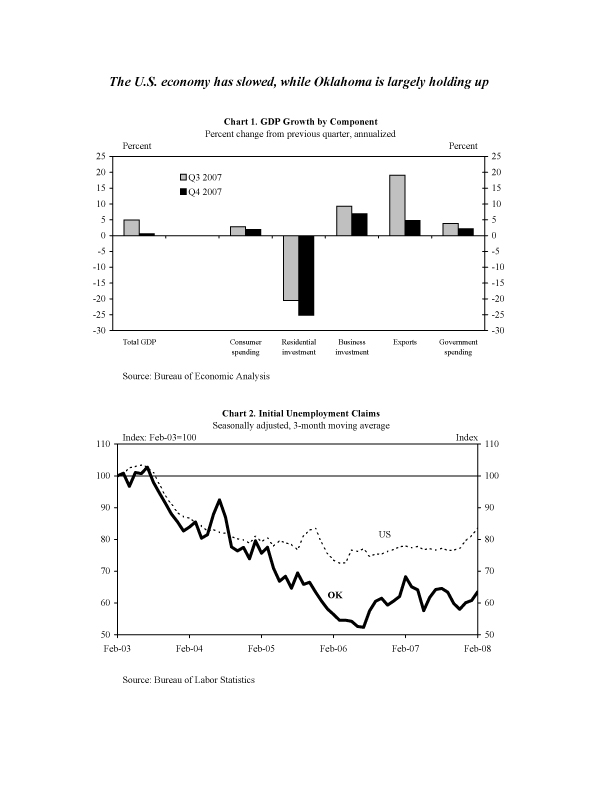
I had the distinct pleasure of hearing from Chad Wilkerson, the Assistant Vice President and Oklahoma City Branch Executive of the Federal Reserve Bank of Kansas City, last night at the COHBA general membership meeting. These meetings are both enjoyable and educational. Visiting with the builders, contractors, and suppliers generally gives me a little insight to the overall sentiment out there about the central Oklahoma real estate market, from a non-consumer standpoint. Last night's guest speaker is what really drove it home for many of us, though. We've all known for a long time that we have a very unique market here in Oklahoma, and that many parts of the country are suffering right now, while we're still plugging right along. Sure, there's been a bit of a slowdown around here, and we're somewhat affected by what's going on nationally, but our overall numbers aren't matching up with the perception that's out there about the Oklahoma City and Edmond real estate market. The proof's in the pudding; check out these charts that Mr Wilkerson so graciously provided: (click on them to see larger images)
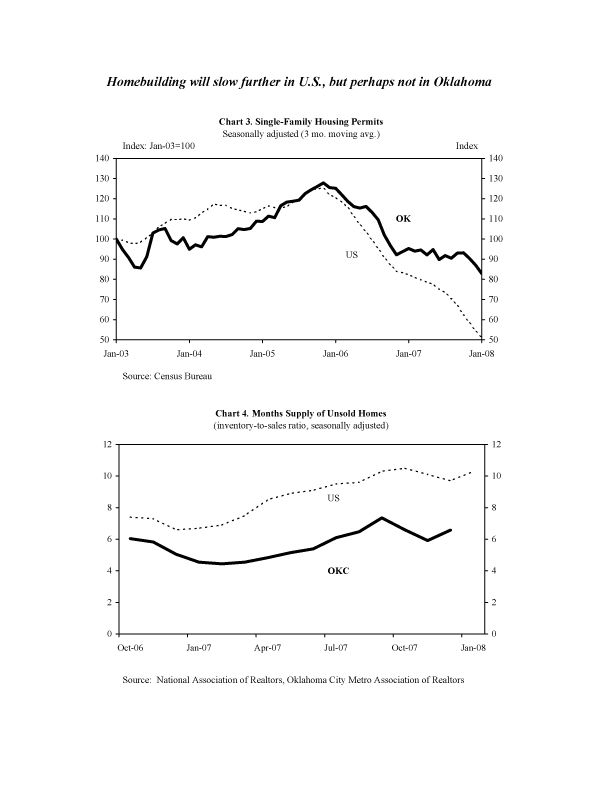
As you can see in chart 1 above, Oklahoma's GDP growth slowed in the fourth quarter, but is still increasing in most segments. The great news with this particular illustration though, is in chart 2. Oklahoma's unemployment claims have seen a dramatic decrease over the past several years, and the gap between our numbers and those of the rest of the country seems to continue to get larger. Can we say job growth?! Chart 3 above shows us that new home construction permits have sharply declined around the country, including Oklahoma, but notice that we're still over 80% of this time 5 years ago, whereas the US is averaging only 50% of 5 years ago. We're apparently doing a great job of controlling inventory levels as well, as shown in chart 4. This is where the absorption rate figures I often post are reflected. Common opinion is that a 4 to 6 month inventory level is healthy, and this chart shows that we've stayed in that range consistently over the past several years. These last 2 charts are the ones that show us how we're doing as far as market appreciation is concerned. These are the numbers that most home owners and home buyers are most interested in. As you can see, we're still experiencing consistent annual increases in our home values, while the rest of the country is actually experiencing no appreciation or even, in some cases, depreciation. IMO, from a consumer standpoint, chart 6 is vitally important. This gives you the big picture view of why it's best to stop listening to the national media and pay more attention to your local sources of information, such as local Realtors, Chamber of Commerce, etc. Even our local reports have, at times, given a more local assessment of the market. We're still on the right track, and hopefully this information has helped, even just a tiny bit, with solidifying your confidence in Edmond homes. And THANK YOU Mr Wilkerson for sharing your insight.


Comments(0)