The Phoenix Real Estate Market has it's ups and downs, just like any housing market.
The good news for for potential home buyers and property sellers alike: home sales to owner occupants (those wanting to live in the homes ) are up 6% from 12-months ago. This seems to indicate that more potential buyers are reasonably at ease with the state of the housing market and are making a commitment to buy a house.
Phoenix Housing Market Information
The bad news is for people trying to sell homes: overall sales remain at a six-year low, due mostly to a 36% decrease in investor sales. I know, some of you are thinking "less investors sales" are better for home values in the Phoenix real estate market. While that's true it also means sellers have to compete for buyers. More on that below under the heading "Investors in the Phoenix Real Estate Market."
Home sales typically decline as we near the holiday season. If sellers can take any solace it's that owner occupants have more confidence in the market and are buying more homes. Imagine where we could be if home loans were a little easier to get.
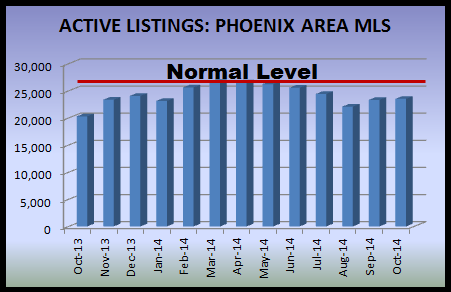
New property listings in the Phoenix real estate market and MLS have remained low. In September 2014 there were 10% less new listings than last year and 8% less than the previous year of 2012. Weakness in demand (less home sales) is a contributing factor to the small increase we had in Phoenix MLS listings .
October 2014 started with 23,519 active MLS listings in the Phoenix real estate market, or just a few hundred more than September. The red line on the below graph indicates the normal level of active listings, which is about 26,000 homes for sale, in the Phoenix MLS.

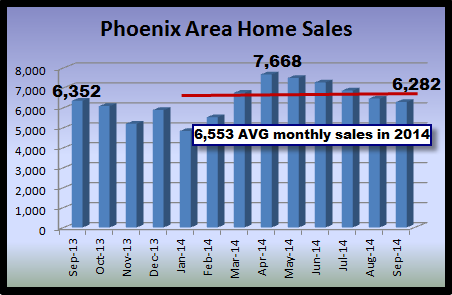
The below chart indicates 6,282 sold properties in September 2014 in the Phoenix real estate market. Sales historically decline as we approach the end of the year, so it's not unusual for September's home sales to be less than August's home sales. We added the red line on the chart below which indicates an average of 6,282 home sales per month for all of 2014. This is the lowest level since 2008.

The below chart shows "foreclosure-type" sales over the last eight Septembers. By foreclosure-type sales we mean bank owned homes (REO's) and short sales. Phoenix foreclosures have returned to normal levels and that's where they appear ready to stay. There are no increases in the number of Notices of Default (NOD's). As seen in the below chart, 2009 and 2011 had the most ...
Finish the report and see video at: Phoenix Housing Market
Create a Phoenix Real Estate Portal
ADVANTAGES of a PORTAL ACCOUNT:
- Save your Phoenix Rea Estate searches
- Get updates on listings
- Track Phoenix MSL listings
- Add notes and messages
- Personalize your dashboard
- Share on social networks

Comments(2)