In the course of my day to day to activities, I oftentimes get asked about the appreciation rate in the Austin market, and my thoughts on the future of the Austin housing market. When responding to these inquiries, it’s important that I explain the different methodologies in calculating the appreciation rate. When you analyze the appreciation rate of anything you are simply comparing the current value to a previous value and reporting the percentage in change. However, the observations derived from these figures can vary drastically by what metrics you are using.
If you look at the appreciation rate based on the average sales price, your results will be skewed by high and low outliers. For this reason, I prefer to use the median sales price when assessing the appreciation rate for Austin area homes. However, simply utilizing the median sales price has its own flaws. What if the homes sold in 2020 were all much larger than the homes sold in 2019? Your results would be skewed. Thus, when looking at the appreciation rate, I prefer to compare the median price per square foot. Even using this metric, results can still be unreliable. If there were far fewer sales in one year than the other, the appreciation rate derived may not reflect the true nature of the market.
That being said, everyone wants to know what the appreciation rate is for homes in the greater Austin area. I myself was curious after looking over the year over year growth for Austin homes from July 2019 to July 2020. I knew that by only comparing these two months of data, the statistics were not illustrating the true picture for certain neighborhoods. Thus, I got to work and combed through the data to try to form a more clear picture.
Before I illustrate my findings, I would like to point out a few factors in regards to the data utilized. All of the information I pulled was from the Austin Board of Realtors MLS. I limited my search to the most central Austin area zip codes, and I analyzed sales data for all single family homes. This included new and existing condo, townhome, and traditional home sales. I compared the sales thus far in 2020 with all sales in 2019. Inherently, there are some flaws to this approach as there is a complete year of data for 2019 and only partial data for 2020. That being said, here is what I found.
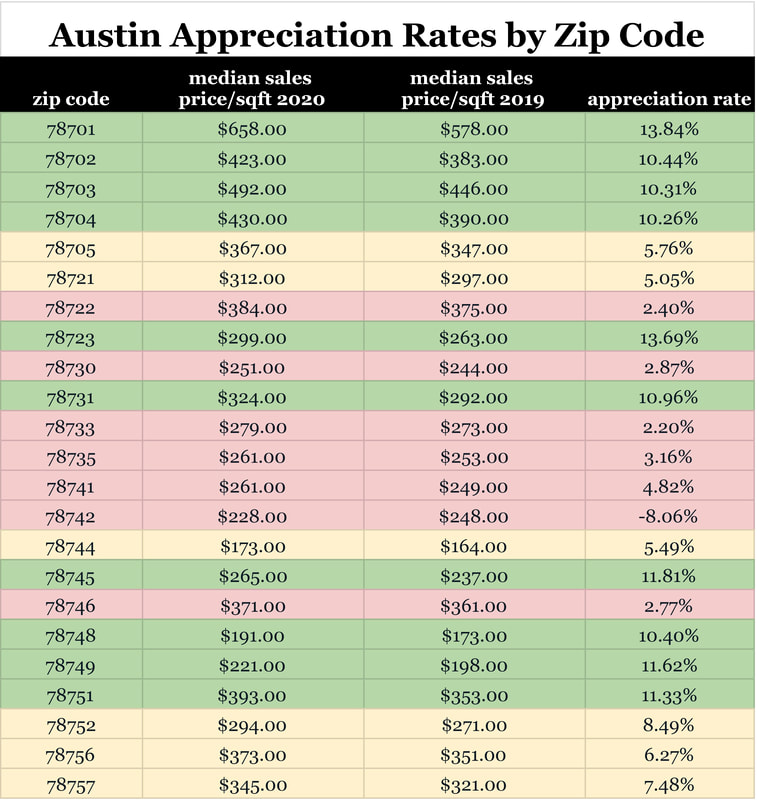
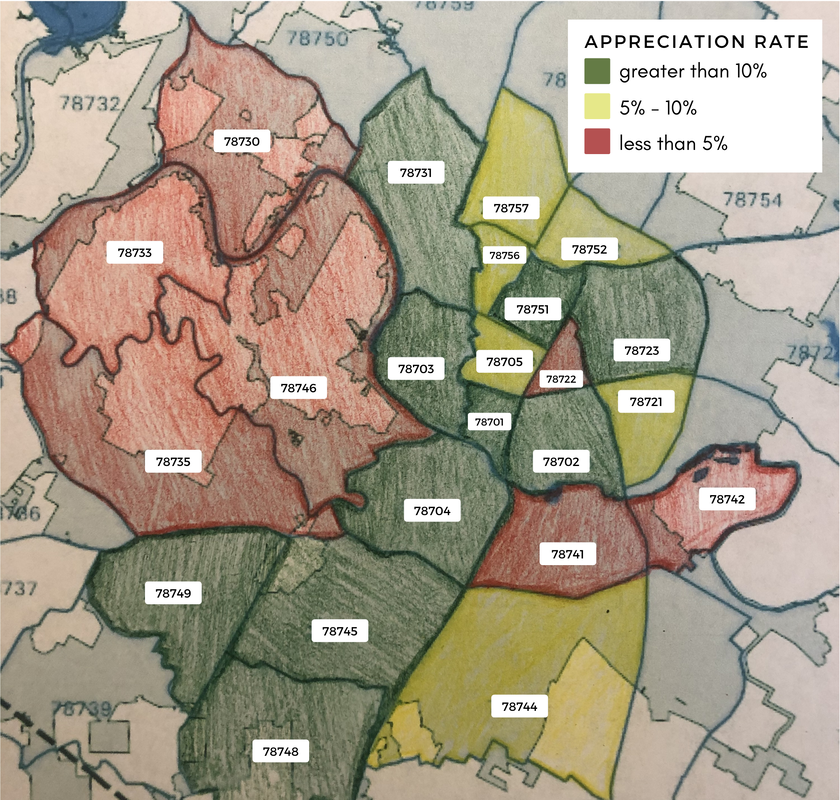
If you look at the median sales price per square foot, the 78701 zip code had the highest appreciation rate among central Austin zip codes. 78701 had an appreciation rate of 13.84% with the median sales price per square foot in 2020 at $658. This data was pulled from approximately 160 sales in 2020 compared to around 300 sales in 2019. It will be interesting to review these stats once a full year of data for 2020 is available. However, this downtown zip code has a strong track record of appreciation with an increase of about 10% for the median sales price per square foot between 2018 to 2019.
The 78742 zip code showed the lowest level of appreciation in the Austin area. In fact, it was the only zip code I analyzed that actually depreciated between 2019 to 2020. In 2020, the median sales price per square foot was $228 compared to $248 in 2019. However, there were only two sales in 2020 and five in 2019, and thus this data set is too small to draw meaningful conclusions.
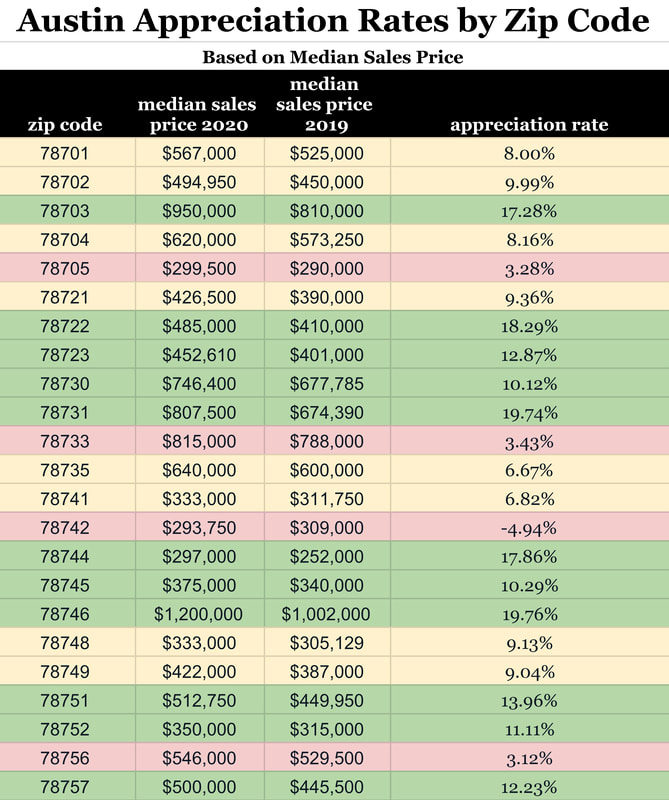
Although, I think the results are less significant, I also analyzed the appreciation rate among the same Austin area zip codes based on the median sales price. Based on this methodology, the zip code in Austin with the highest appreciation rate between 2019 to 2020 is 78746. Homes in 78746 appreciated 19.76% between 2019 to 2020. This data was pulled from 426 sales in 2019 and 232 sales in 2020. The 78742 zip code similarly showed the lowest level of depreciation when analyzing the change based on the median sales price; however, as previously mentioned, the limited number of total sales in this zip code obscures the validity of this figure.
The 78742 zip code showed the lowest level of appreciation in the Austin area. In fact, it was the only zip code I analyzed that actually depreciated between 2019 to 2020. In 2020, the median sales price per square foot was $228 compared to $248 in 2019. However, there were only two sales in 2020 and five in 2019, and thus this data set is too small to draw meaningful conclusions.
Although, I think the results are less significant, I also analyzed the appreciation rate among the same Austin area zip codes based on the median sales price. Based on this methodology, the zip code in Austin with the highest appreciation rate between 2019 to 2020 is 78746. Homes in 78746 appreciated 19.76% between 2019 to 2020. This data was pulled from 426 sales in 2019 and 232 sales in 2020. The 78742 zip code similarly showed the lowest level of depreciation when analyzing the change based on the median sales price; however, as previously mentioned, the limited number of total sales in this zip code obscures the validity of this figure.
All in all, it is important to assess appreciation rates in the Austin real estate market. When you own a home and its value appreciates over time, you make money when you sell! And, when you leverage your home purchase with a mortgage, that appreciation benefit is compounded based on the fact that you’re profiting off the appreciation value of the entire home, when only paying a portion of the home’s value in your down payment. For example, if you bought a home for $300,000 and put 20% down ($60,000) and that home appreciated 10% you would make a $30,000 gain on a $60,000 investment. It’s a bit more complicated when you throw mortgage payments into the mix, but you can easily see why understanding a given area’s appreciation rate is important. That being said, make sure to take a comprehensive look at the data and recognize its potential limitations when evaluating a market based on the appreciation rate.
If you have questions about the appreciation rate in your Austin neighborhood, contact me today. I’d be happy to do the research and provide you with the data you need to make an informed decision.
If you have questions about the appreciation rate in your Austin neighborhood, contact me today. I’d be happy to do the research and provide you with the data you need to make an informed decision.
This post originally appeared on shesellsaustin.com


Comments(4)