- January 2022 Scottsdale Homes for Sale and Home Sales -
We saw the seasonal dip in home sales in January as buyers took some time off to enjoy the holidays. However, we did see a rebound in the number of homes under contract.
The most concerning thing is that inventory fell even further by the end of the month. This is really putting pressure on buyers who are ready to purchase, but are unable to because of competition.
SCOTTSDALE HOME SALES ACTIVITY – JANUARY 2022
We track the following sales metrics on a monthly basis:
- Single-family homes for sale - Orange Line - How many homes were listed at the end of the month.
- Under contract, but accepting backup offers (UCB) - Gray Line - How many homes were in UCB status at the end of the month.*
- Pending home sales - Yellow Line - How many pending sales there were at the end of the month.*
- Home Sales - Blue Line - How many homes sold during the month.
JANUARY 2022 RESULTS
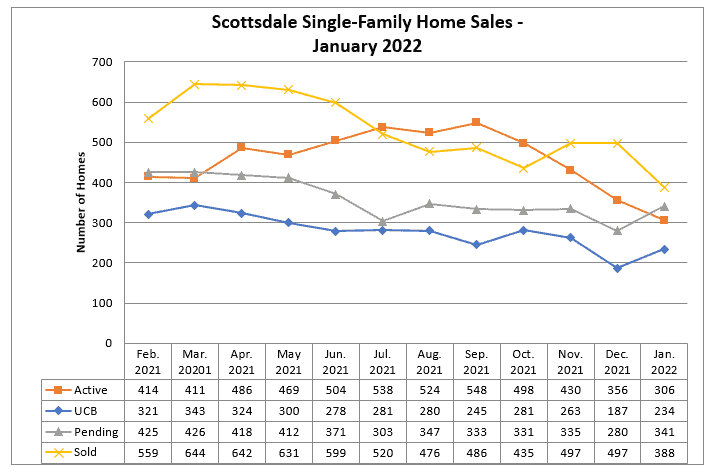
- Scottsdale Homes for Sale: The number of homes for sale fell by another 50 at the end of January. This is the lowest it has been in the past year. We need to see this figure increase to move back toward a balanced market.
- UCB (Under contract, accepting backup offers): The number of UCB contracts rebounded 20% in January to close out at 234, which is similar to where UCBs were toward the end of 2021.
- Pending Homes Sales in Scottsdale: Pending contracts were also up by the end of the month and were more inline with where they were for several months in 2021.
- Scottsdale Home Sales: Sales fell in January, which was to be expected after quieter contract activity over the holiday season.
The next two items are also sales metrics that we monitor.
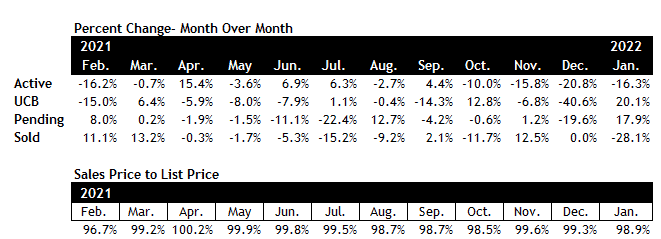
Percent Change Month Over Month - This first section compares sales activity of a month to the month directly before it. For instance, pending sales were up 17.9% between December 2021 and January 2022. This chart allows you to spot any trends that are happening.
Sales Price to List Price - The second section is a quick way to see what homes are selling for compared to what they were on the market for. In January, it was 98.9%. That means on average, buyers saw a 1.1% discount off of asking prices.
*Figures for active homes for sale, UCB sales and pending sales are based on the numbers at the end of the month.
Curious about your buying power? Click on the link to learn more.
Search Scottsdale AZ Homes for Sale
Disclaimer: Data and information were pulled from the Arizona Regional MLS (ARMLS) as of 2/1/2022. Information deemed reliable, but not guaranteed. There may be new home inventory in these figures if the developer is using the MLS to market its homes. This post represents the opinion of the author. No warranties express or implied.
Copyright © 2022 Heather Tawes Nelson | Joyce Tawes


Comments(0)