The Austin Rental market keeps chugging along, not burning up any records, but a slow march back toward the better rental rates Austin landlords once enjoyed. Below are the rental stats for January 2007. Since we're at the start of the year, I'm not doing a Year-to-Day, as obviously that would just be January anyway, but I've included the 2005/2006 full year comparisons further below, from my year-end Austin Rental Market Summary summary last month. Also below is the Austin rental rate trend graph from 1999 through 2006.
| Dec 2006 | Jan 2007 | Jan 2006 | Yr % Change | |
| # Leased | 538 | 594 | 579 | 2.6% |
| Avg List Price | $1248 | $1239 | $1182 | 4.8% |
| Median List Price | $1150 | $1150 | $1100 | 4.5% |
| Avg Leased Price | $1238 | $1235 | $1173 | 5.3% |
| Med Leased Price | $1150 | $1145 | $1100 | 4.1% |
| Avg Size SQFT | 1864 | 1876 | 1785 | 5.1% |
| Median SQFT | 1747 | 1771 | 1719 | 3.1% |
| Avg $ per SQFT | $0.65 | $0.66 | $0.66 | 0% |
| Avg Days on Mkt | 60 | 61 | 47 | 30% |
| Median Days on Mkt | 51 | 50 | 51 | 2% |
Below is the 2005/2006 full year comparison.
| All 2006 | All 2005 | Yr % Change | |
| # Leased | 8042 | 5949 | 35% |
| Avg List Price | $1268 | $1249 | 1.4% |
| Median List Price | $1150 | $1150 | 0 |
| Avg Leased Price | $1256 | $1237 | 1.4% |
| Med Leased Price | $1150 | $1150 | 0 |
| Avg Size SQFT | 1850 | 1806 | 2.4% |
| Median SQFT | 1750 | 1701 | 2.9% |
| Avg $ per SQFT | $0.68 | $0.68 | 0 |
| Avg Days on Mkt | 54 | 60 | -10% |
| Median Days on Mkt | 43 | 48 | -10% |
Below is the 1999 through 2006 rental trend graph for Austin TX.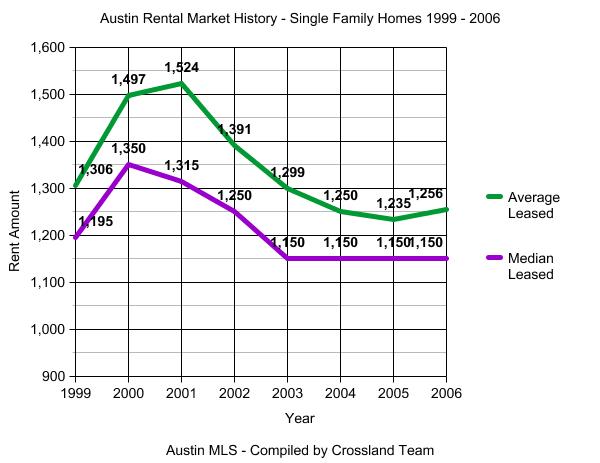
| MLS Area | # of Homes Leased | Avg $ Amt Leased | Avg SQFT | Avg $ | Avg Days | Avg Yr Built | ||||
| 2005 | 2006 | %Chg | 2005 | 2006 | %Chg | |||||
| Area 1A | 34 | 26 | -24% | $2045 | $2101 | 3% | 2225 | $0.94 | 36 | 1978 |
| Area 1B | 198 | 193 | -3% | $1676 | $1847 | 10% | 1593 | $1.16 | 44 | 1947 |
| Area 1N | 174 | 191 | 10% | $1261 | $1370 | 9% | 1831 | $0.75 | 42 | 1983 |
| Area 2 | 128 | 146 | 14% | $1052 | $1152 | 9% | 1222 | $0.94 | 38 | 1957 |
| Area 2N | 117 | 133 | 14% | $1015 | $1063 | 5% | 1446 | $0.74 | 56 | 1975 |
| Area 3 | 137 | 169 | 23% | $1095 | $1123 | 3% | 1389 | $0.81 | 51 | 1962 |
| Area 3E | 26 | 61 | 135% | $976 | $1067 | 9% | 1448 | $0.74 | 67 | 1994 |
| Area 4 | 132 | 161 | 22% | $1422 | $1556 | 9% | 1395 | $1.12 | 52 | 1955 |
| Area 5 | 83 | 147 | 77% | $994 | $1011 | 2% | 1215 | $0.83 | 58 | 1968 |
| Area 5E | 40 | 70 | 75% | $1030 | $1008 | -2% | 1674 | $0.60 | 70 | 2002 |
| Area 6 | 71 | 104 | 46% | $1359 | $1390 | 2% | 1266 | $1.10 | 39 | 1954 |
| Area 7 | 37 | 28 | -24% | $1455 | $1572 | 8% | 1439 | $1.09 | 37 | 1957 |
| Area 8E | 41 | 40 | -2% | $2456 | $2631 | 7% | 2412 | $1.09 | 39 | 1978 |
| Area 8W | 89 | 93 | 4% | $2124 | $2155 | 1% | 2494 | $0.86 | 41 | 1990 |
| Area 9 | 26 | 20 | -23% | $1140 | $1114 | -2% | 1371 | $0.81 | 41 | 1977 |
| Area 10 | 447 | 588 | 32% | $1086 | $1144 | 5% | 1530 | $0.75 | 43 | 1986 |
| Area 11 | 89 | 129 | 45% | $985 | $994 | 1% | 1449 | $0.69 | 58 | 1989 |
| Area BA | 75 | 74 | -1% | $991 | $982 | -1% | 1641 | $0.60 | 40 | 1986 |
| Area BL | - | - | - | - | - | - | - | - | - | - |
| Area BU | 2 | 4 | 100% | $1042 | $1097 | 5% | 1589 | $0.69 | 35 | 1985 |
| Area BW | 11 | 16 | 45% | $965 | $971 | 1% | 1572 | $0.62 | 61 | 1987 |
| Area CC | 4 | 5 | 25% | $986 | $895 | -9% | 1294 | $0.69 | 29 | 1987 |
| Area CL | 738 | 975 | 32% | $1130 | $1173 | 4% | 1994 | $0.59 | 53 | 2000 |
| Area EL | 13 | 19 | 46% | $914 | $1025 | 12% | 1890 | $0.54 | 73 | 2001 |
| Area FC | - | - | - | - | - | - | - | - | - | - |
| Area GP | - | - | - | - | - | - | - | - | - | - |
| Area GT | 118 | 165 | 40% | $1150 | $1181 | 3% | 1855 | $0.64 | 52 | 1995 |
| Area HD | 40 | 86 | 115% | $1483 | $1675 | 13% | 2243 | $0.75 | 59 | 1999 |
| Area HH | 301 | 419 | 39% | $1077 | $1078 | 0% | 1816 | $0.59 | 53 | 2003 |
| Area HS | 21 | 8 | -62% | $1058 | $1114 | 5% | 1769 | $0.63 | 92 | 2002 |
| Area HU | 177 | 273 | 54% | $1064 | $1030 | -3% | 1884 | $0.55 | 68 | 2004 |
| Area HW | 28 | 33 | 18% | $1124 | $1236 | 10% | 1741 | $0.71 | 73 | ? |
| Area JA | 2 | 3 | 50% | $1000 | $1383 | 38% | 1604 | $0.86 | 58 | 2004 |
| Area LC | - | - | - | - | - | - | - | - | - | - |
| Area LH | 2 | 4 | 100% | $1047 | $1400 | 34% | 1928 | $0.73 | 23 | 1983 |
| Area LL | - | - | - | - | - | - | - | - | - | - |
| Area LN | 55 | 81 | 47% | $1261 | $1244 | -1% | 1683 | $0.74 | 62 | 1987 |
| Area LS | 170 | 193 | 14% | $1672 | $1767 | 6% | 2157 | $0.82 | 54 | 1993 |
| Area MA | 100 | 139 | 39% | $1117 | $1041 | -7% | 1822 | $0.57 | 80 | 2004 |
| Area MC | - | - | - | - | - | - | - | - | - | - |
| Area N | 161 | 172 | 7% | $1162 | $1185 | 2% | 1736 | $0.68 | 48 | 1990 |
| Area NE | 100 | 199 | 99% | $1060 | $1134 | 7% | 1799 | $0.63 | 57 | 1997 |
| Area NW | 241 | 259 | 7% | $1211 | $1276 | 5% | 1916 | $0.67 | 49 | 1986 |
| Area PF | 455 | 648 | 42% | $1197 | $1144 | -4% | 1936 | $0.59 | 62 | 2000 |
| Area RN | 53 | 113 | 113% | $2312 | $2310 | 0% | 2876 | $0.80 | 53 | 2001 |
| Area RR | 775 | 1244 | 61% | $1176 | $1186 | 1% | 2024 | $0.59 | 58 | 1999 |
| Area SC | 20 | 50 | 150% | $1258 | $1186 | -6% | 2022 | $0.59 | 55 | 2000 |
| Area SE | 33 | 64 | 94% | $1040 | $1057 | 2% | 1875 | $0.56 | 70 | 2002 |
| Area SV | 6 | 6 | 0% | $1083 | $940 | -13% | 1560 | $0.60 | 53 | 1976 |
| Area SW | 311 | 415 | 33% | $1470 | $1480 | 1% | 2139 | $0.69 | 46 | 1995 |
| Area TC | 9 | 16 | 78% | $837 | $816 | -3% | 1447 | $0.56 | 61 | 1975 |
| Area W | 56 | 67 | 20% | $1651 | $1754 | 6% | 2150 | $0.82 | 58 | 1989 |
| Area WE | - | - | - | - | - | - | - | - | - | - |
| Area WW | - | - | - | - | - | - | - | - | - | - |

Comments(2)