Condo Sales Gaining Momentum for Vancouver WA in May 2018

With the overall real estate market in a tight Seller's Market, the condo + attached-home segment is facing the same challenges, with inventory small and prices rapidly rising. Here are some of the key points for this month's report:
- Condo Sales Prices are rapidly rising, with the 3-Month Moving Average now up to $266,275 which is up 18.29% over the prior May; and the 12-Month Moving Average is up 15.08% from the prior year;
- 54 Resale Condos were sold in May, which is 0 more units sold (0%) from May 2017, and 9 more than last month;
- REO/Bank Owned Condo sales were 0 units (0% of total); down from 3 (5.6% of total) in May 2017.
- Short Sale /Pre-Foreclosure property sales were 0 units (0% of total); down from 1 (1.9% of total) in 2017.
Unit-volume trends - both short-term and long-term, are shown below in the custom charts we've prepared using RMLS data:
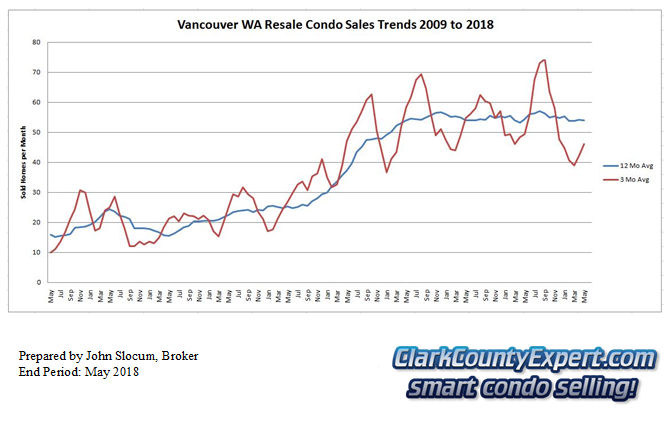 Vancouver WA Resale Condo Sales - Units Sold Trend May 2018
The unit-sales trend is showing signs of stress, with this year's time in the Winter doldrums going deeper and lasting longer than the two most recent prior years. It also appears the upward-slope this year is not as steep as last year. We did see a strong upward move in New Listings this month, and we shall track that to see if that will translate into more unit-sales.
 Vancouver WA Resale Condo Sales - Average Sales Price Trend
Prices have clearly shown strong upward momentum this year, with the short-term slope rather steep and extended; with the long-term line's slope becoming steeper as well. At this point it is fair to say that on average the price has been increasing over 1% per month!
The final set of charts show Unit Sales, Average & Median Prices; and Days on Market information (from RMLS chart-tools):
 Vancouver Condo Sales Inventory & Days on Market Trends
Inventory-by-Month is showing New Listings moving up the strongest, with Pending Sales and Closed Sales also posting good gains. The season is still early, and we'll keep an eye on the dynamics here and the overall impact on Active Inventory.
The middle graph is showing Closed Prices moving down slightly this month, with the Average Price for New Listings coming in significantly higher than closed sales.
Lastly, the Average Days on Market actually increased, although in a reasonable range for this time of year; and the Median Days on market shrank by a few days time.
We hope you find value in our write-up on the Condo market in Vancouver WA for May 2018. We are happy to receive your questions or comments; and would love to help you Sell or Buy your Condo!
PS - Our Team, especially John Slocum, loves to help Condo Owners Sell their Condo. This market segment is Red-Hot and now is a great time to call to get started with a Market Valuation for your Vancouver Condo, and to learn more on how the sales process works in this fast-paced market.
PPS - We also love to help Condo Buyers! Contact us at your earliest convenience and discuss your interests and timing. We'll be glad to set you up with an Automated Search program in RMLS or, you may visit the Condos For Sale in Vancouver WA page at our website, where we have endeavored to make it Easy for you to search by Neighborhood for Condos, with listings for condos from the entire RMLS. Some of the favorite Neighborhood Searches include Condo for sale on the Vancouver WA Waterfront; Condo for sale in Downtown Vancouver Washington, Vancouver Washington Luxury Condos for sale.
The statistical charts for Vancouver WA Condos in this report (prepared by Vancouver WA Condo Listing Broker John Slocum, our resident statistician) are based on condo sales recorded in the Vancouver MLS system (RMLS), excluding sales of newly constructed condos; and shows the purchase activity since 2009; charting the 3 month Moving average number of sales, and the 12 month Moving average. The "smoothing" of the relatively sparse-data helps to better illustrate the short-term and longer term trends in Vancouver's Condominium market.
Disclaimer: as with all real estate statistics, we do our best to provide the best representation at the time the data was acquired. We deem the data and reports reliable but not guaranteed.

Comments(0)