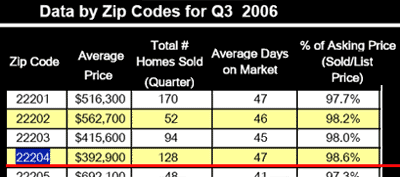
When I first saw these numbers, I was shocked that the zip code 22204 was able to get 98.6% of the list price. Only a drop of 1.4%? How is that possible in such a slow market?
So I set out to recreate the numbers and I finally think that I understand how they came up with their data. I don't question whether the data is correct, I just question how it is presented.
I believe now that the "% of Asking Price" means the "% of the last and lowest asking list price to the sold price, excluding seller subsidies." So if a house was initially listed at:
Hypothetical example:
$600,000 Starting Price
$500,000 Lowered List Price
$495,000 Contract price
$10,000 Seller subsidy (about average for 22204)
________
$485,000 Net (counting the $10,000)
= a 1% drop using MRIS's data
= a 20% drop from the top number.
So if you were to include the subsidy and the starting price, the price drop would be almost 20% lower, yet this hypothetical numbers would be reported by the MRIS as a 1% drop ($500k to $495k).
So back to recreating the actual numbers from MRIS. (My Excel document is available upon request.)
I took all homes for the period of 7/01/06 to 9/30/06. I found 72. This number is off from their their 128, I'm not sure why.
From this data I was able to come very close to recreating their numbers (option 1 below).
1) % of Final list price was 98.4% (vs their 98.6%, no big deal).
2) % of Final list price MINUS seller subsidy= 96.8%
3) % of Original list price MINUS seller subsidy= 94.25%
4) % of Highest price (prior Realtor or listing#) MINUS seller subsidy= 92.2%
Using the $600k example from earlier, #3 takes the starting price of $600k and counts the $10,000 seller to make a final closed price of $485,000. However #4 above takes into account if the listing had a prior agent with an even higher price. So with #4 I took the starting price of a house regardless of how many Realtors had tried to sell it, or how many times one Realtor relisted it to reset the Days on the Market.
So while the MRIS data is not necessarily incorrect, the public should know that it does NOT mean that the average house in that zip code only dropped 1.4% from what the seller started with. That number is probably closer to an 8% drop once you count the seller subsidy (which was near 0 a couple years ago) and the initial starting price.
Recalculated drop for 22204: 8% (92.2% of the starting list price, including subsidies)
Conclusion: Don't assume information that is given to you is correct, question how the numbers are compiled.
- Written by Frank Borges LL0SA- Broker/Owner FranklyRealty.com
703-827-4006
Blog.FranklyRealty.com
Videos at YouTube.FranklyRealty.com
Keywords: Housing bubble? Arlington, Alexandria, MLS MRIS, search, Homes, Real estate, Virginia, Alexandria, 22201, 22314, Fairfax Va, DC Realty, Realtor

Comments(5)