The Phoenix Housing Market has been anything but stable over the last 7 years. That's all been changing over the last few months. Are we headed back to a buyer's market? Let's have a look at the facts.
 Inventory is up, demand is down, and foreclosure type properties have evaporated. Our Phoenix Housing Tracker started keeping statistics about 6 years ago. The combination of factors in today's market creates the closest thing to a stable market we've seen during that time.
Let's begin with inventory in the Phoenix Housing Market. 25,000 active listings was the standard for a balanced Phoenix Housing Market before the housing boom. Total active listings at the end of October 2013 were 23,358, up from 20,285 at the beginning of October. That's an increase of 3,073 (or 15% - see the complete tables here: Active Phoenix MLS Listings). Orange indicates REO property, light blue indicates short sales, and darker blue is normal sales.
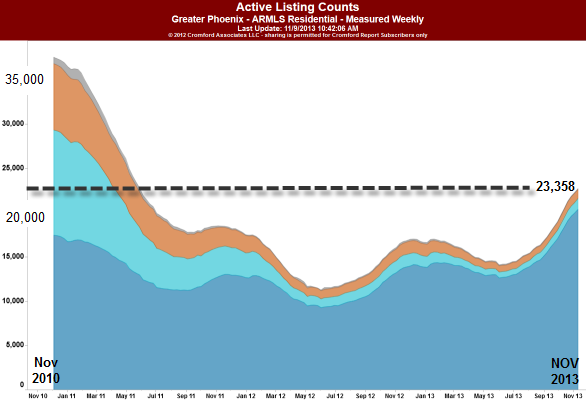
Chart by way of paid subscription to the Cromford Report
By looking at the chart you might be thinking "the Phoenix Housing Market had a similar number of listings in June 2011 when the market was at the bottom. What makes November 2013 different?"
The difference lies in the number of foreclosure listings. As seen in the chart below, and during May-June 2011, there were approximately 10,000 bank owned and short sale properties still driving prices downward. Today there are approximately 2,200 of these foreclosure type properties and they are having very little, if any effect on pricing in the Phoenix Housing Market.
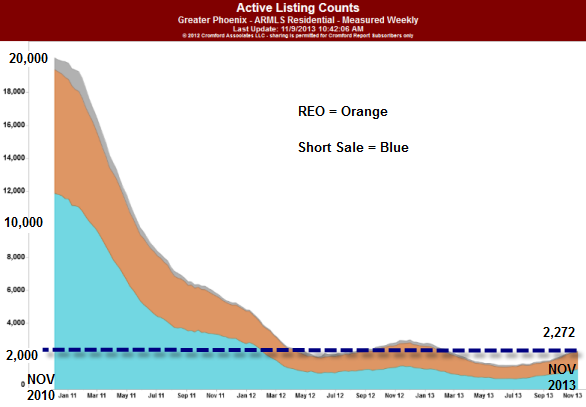
Chart by way of paid subscription to the Cromford Report
The next chart is further proof that foreclosures in the Phoenix Housing Market have returned to normal levels. It shows the number of trustee's sales by month. A trustee sale occurs in Arizona after a homeowner misses 6 consecutive mortgage payments. The trustee for the mortgage company sells the home in a public auction. The number of trustee's sales in the Phoenix housing market is back to levels found in the early 2000's.
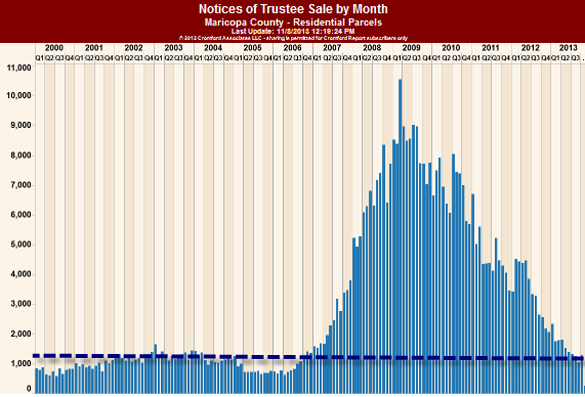
Chart by way of paid subscription to the Cromford Report
SALES IN THE PHOENIX HOUSING MARKET
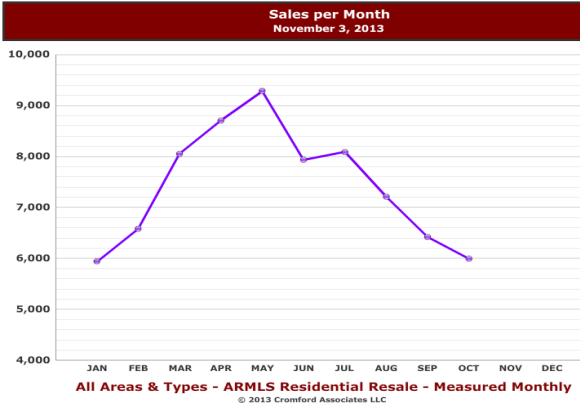
So we come to the heart of the situation. Sales in the Phoenix Housing Market are down. The below chart indicates 6,079 sales which is the lowest number of sales in any October since 2008 (see complete tables here: Phoenix Home Sales Tracker). Additionally, the 6,079 sales represents the lowest sales month in the last 4 years except for January 2010 and January 2013.
The next chart indicates pending sales have been declining since May. Pending sales are those under contract but not yet closed.
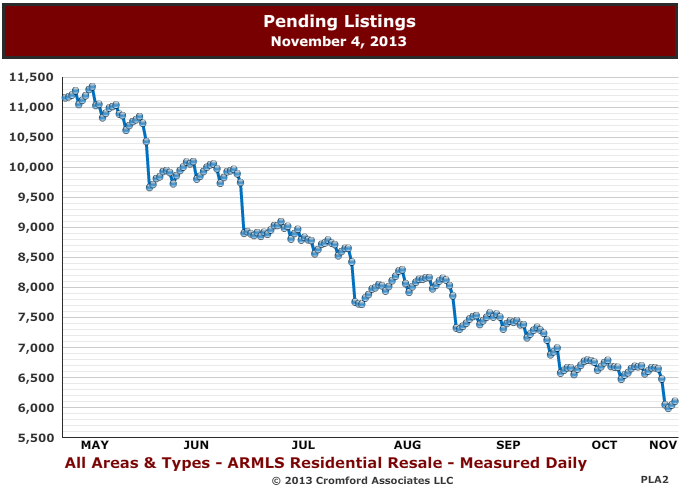
Stated simply: fewer sales in the Phoenix Housing Market are contributing to the increases in inventory.
Soon sellers in the Phoenix Housing Market may not have any significant bargaining power and may have to negotiate concessions. Sellers in the Phoenix Housing Market who still think they are in a seller's market (and price their homes too high) may not get showings.
Potential reasons for less buyers in the Phoenix Housing Market:
- Seasonal down turn
- Some investors are priced out of the market
- The government shutdown and threat of default
- Inaccurate data from the national media
- Comments about housing bubbles by Karl Case despite his partner Robert Shiller's stated opinion that we unlikely to see another housing bubble "in our lifetime"
- Political sequestering while federal budgets are being debated
It would seem all these factors play some role in the Phoenix Housing Market.
The Cromford Report indicates we are currently in a balanced market. Note the gauge reading near 100. 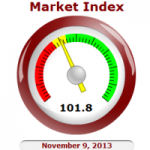
From the Cromford Report: "Cromford Market Index™ is a value that provides a short term forecast for the balance of the market. It is derived from the trends in pending, active and sold listings compared with historical data over the previous four years. Values below 100 indicate a buyer's market, while values above 100 indicate a seller's market. A value of 100 indicates a balanced market."
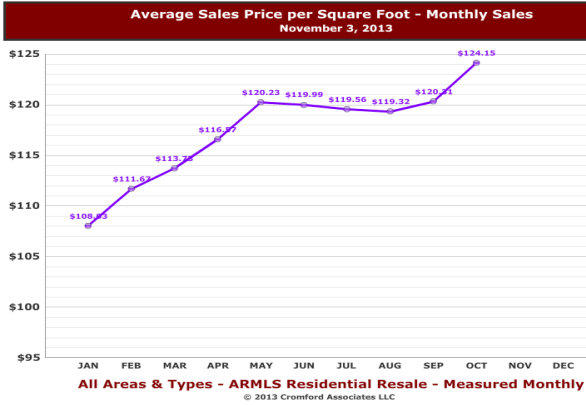
The last chart we'll show you is the price per square foot index. You'll note the price per square foot is $124. Here are two additional points of perspective:
- July 2008 was the last time price per square foot was $124, and at that time prices were rapidly sliding downhill from all-time highs in 2006
- Prices passed $124 in 2004 when the housing boom was forcing prices higher
From our standpoint prices should stabilize around $125 per square foot and we should start to see a normal level of appreciation.
To see a historical perspective on price per square foot in the Phoenix Housing Market go here: Phoenix Price Per square Foot

Comments(2)