Vancouver's Real Estate Market in 2013 Shows a Strong Increase in Units Sold, ending the Year with an Ease to Rising Prices
2013 was a very good year, with strong improvement for the Vancouver real estate market, with these highlights:
- Home Values Were Up at the end of the year, with the 3-Month Moving Average up 5.77% over the prior year; and the 12-Month Moving Average went up 12.4%
- The Price Trend at the end of the year was sharply Downward for the 3-Month Moving Average and Flat for the 12-Month Moving Average
- The Absorption Rate at the end of the year was: 108 Days for Vancouver (vs. 115 Days for Clark County) - Still in the "Seller's Market" Range.
- Approximately 3,812 Resale Homes were sold in 2013, which is about 467 (13.96%) more homes than in 2012.
- REO/Bank Owned property sales were 439 units (11.5% of total); down from 505 (15.1%) in 2012. This is consistent with the other cities in Clark County.
- Short Sale /Pre-Foreclosure property sales were 590 units (15.5% of total); down from 710 (21.2%) in 2012.
As we pointed out in last month's Real Estate Update the Autumn season is traditionally slower, and combined with the economic uncertainty by the shut-down of the US government, caused Clark County and Vancouver to see the first significant break in rising prices in this recovery phase.
Now to the Charts! This first chart shows the number of Resale Homes Sold (Excludes New Construction), with a short term trend line equaling the 3-month Moving Average; and the longer term trend line equaling the 12-month Moving Average.
 Vancouver WA Resale Home Sales - Units Sold Trend 2013
With Vancouver the largest city in Clark County, this trend line seems to look quite a bit like the total for the County. However, for Vancouver the 3 month trend-line shows much bolder moves, up and down, for the year; while the 12 month line produced a nice up-move before leveling off. In all, the increased number of home-units sold is a welcome improvement for this market.
Next we'll look at the current action on Home Prices, with this next chart showing a strong move up of about $30,000 for the 3-month line, only to have it retreat $15,000 in the final months of the year. The 12-month line move up strongly about $23,000, with slight leveling at the end of the year. We also have the 3 month line now lower than the 12-month line, which is something we'll need to watch in the next few months. For now this may be too early to determine the level of significance.
 Vancouver WA Resale Home Sales - Average Sales Price Trend
The final series of chats below show the month-by-month action for Unit Sales, Average & Median Prices; and Days on Market:
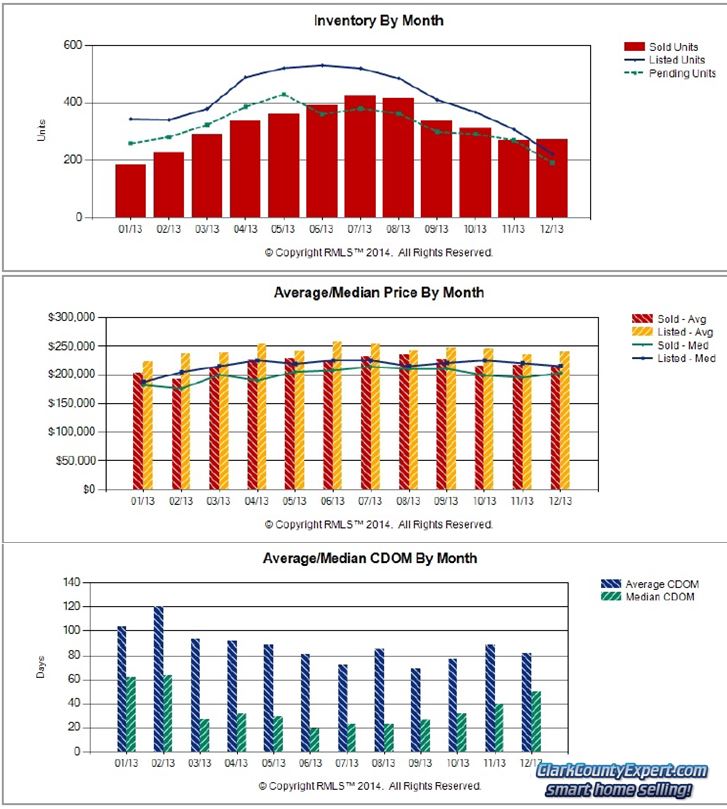 Vancouver Home Sales Inventory & Days on Market Trends
Thess final 3 charts clearly show how Hot the market was in the summer of 2013, with higher Unit Volume, higher Average Prices; and fewer Days on the Market! Also of note is the Steep Decline in New Listings at the end of the Year. Home prices may well rise quickly again if the supply of homes for sale becomes any tighter.
If 2014 is going to behave in a fashion similar to 2013, the first quarter of the year will be the time for Sellers to get their homes ready to sell; and for Buyers the best bargains will be right now!
PS - Visit the Home Search for Vancouver page our website, where we have made it Easy to search by Neighborhood or by Category, with real estate listings from the entire RMLS. Sign-up Not Required!
PPS - the buzz with our team and at the RE/MAX office is that 2014 is starting out Very Strongly. Don't delay with your Home Selling or Buying Plans - Call Us Soon!
The charts in this report (prepared by Realtor® John Slocum, our resident statistician) are based on home sales recorded in the Vancouver MLS system (RMLS), excluding sales of mobile home; and shows the purchase activity since 2009; charting the 3 month Moving average number of sales, and the 12 month Moving average. This "smoothing" of the trend-data helps illustrate the short-term and longer term trends in Clark County's real estate market.
Disclaimer: as with any real estate statistics, we do our best to provide the best representation at the time the data was acquired. We deem the data and reports reliable but not guaranteed.

Comments(3)